Kampala Heat Atlas, first full run. Click any image for full size.
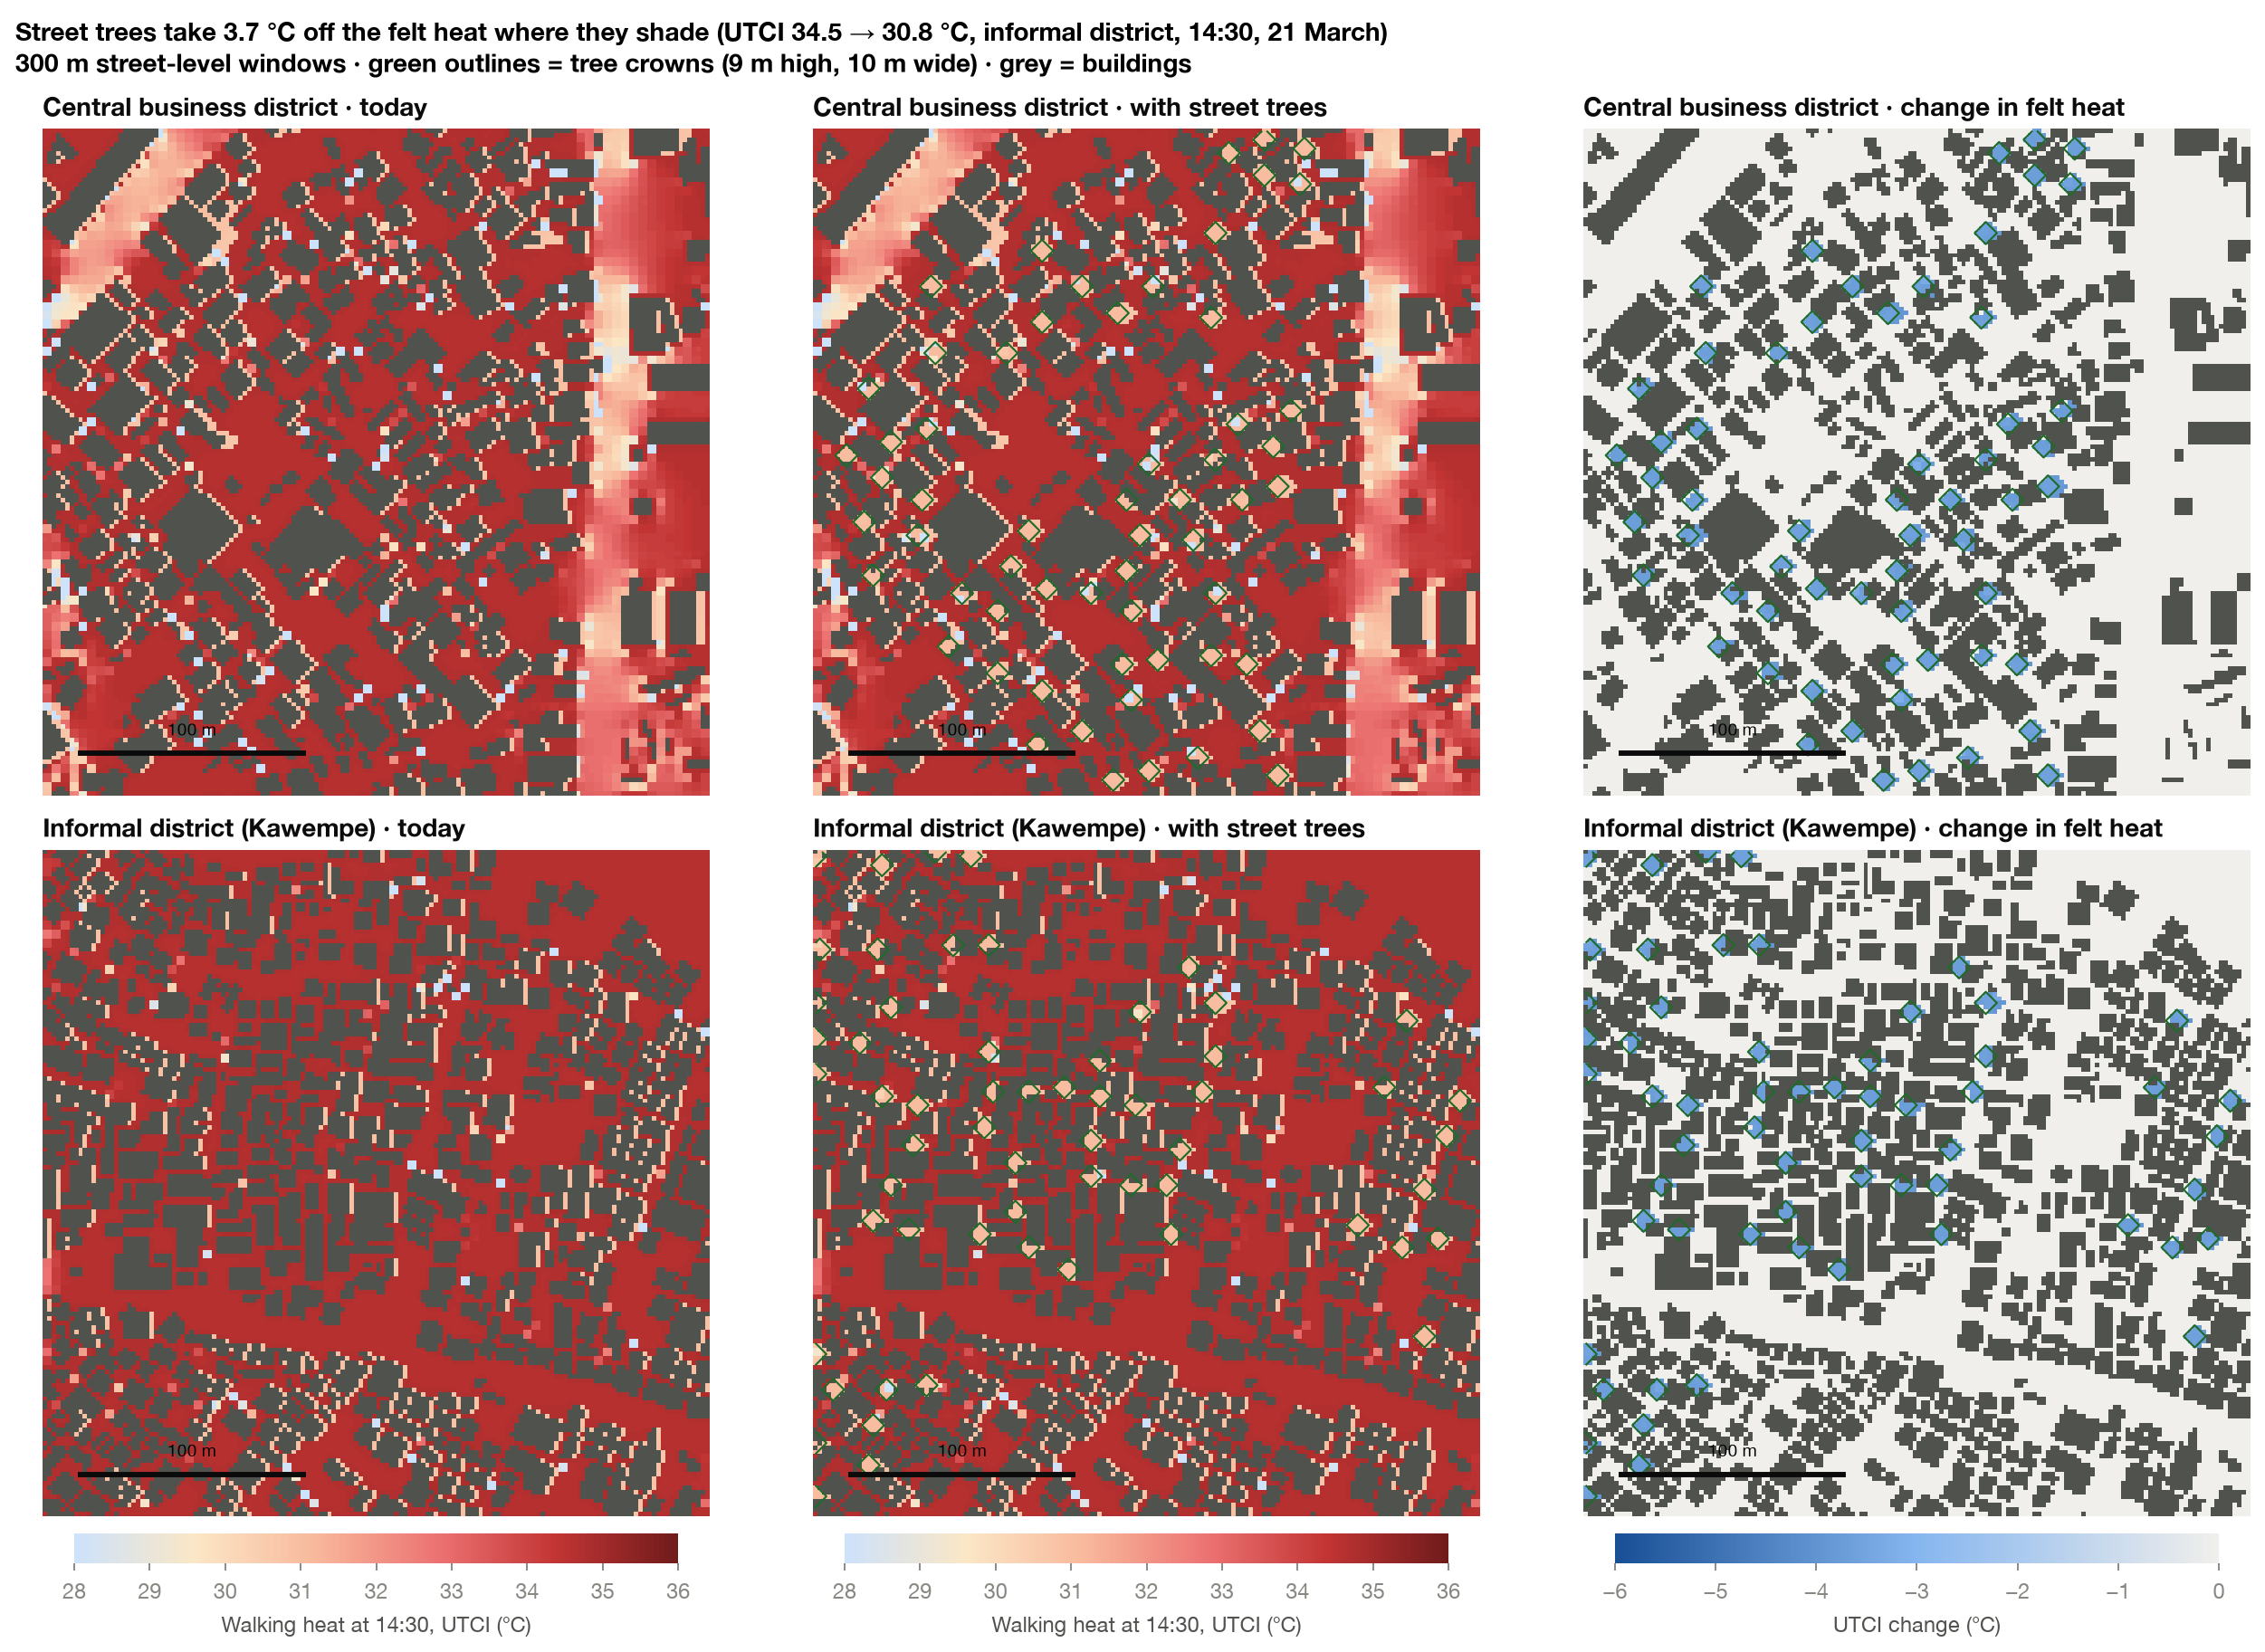
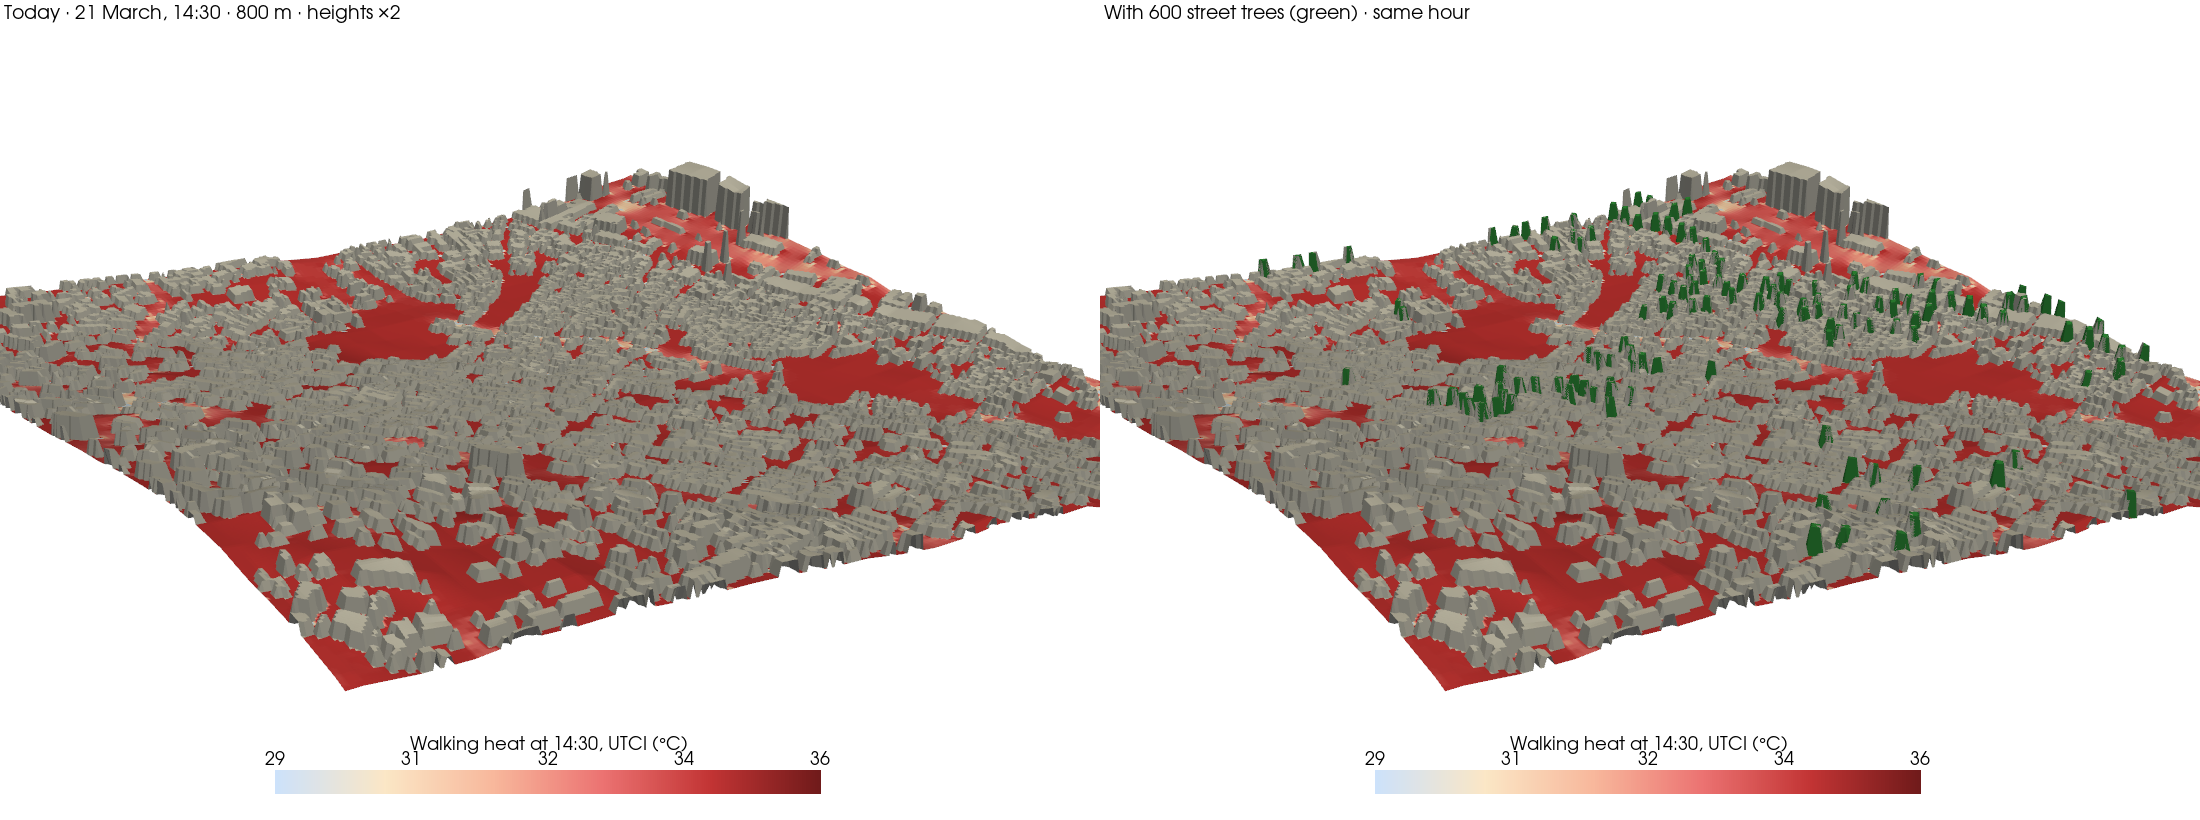
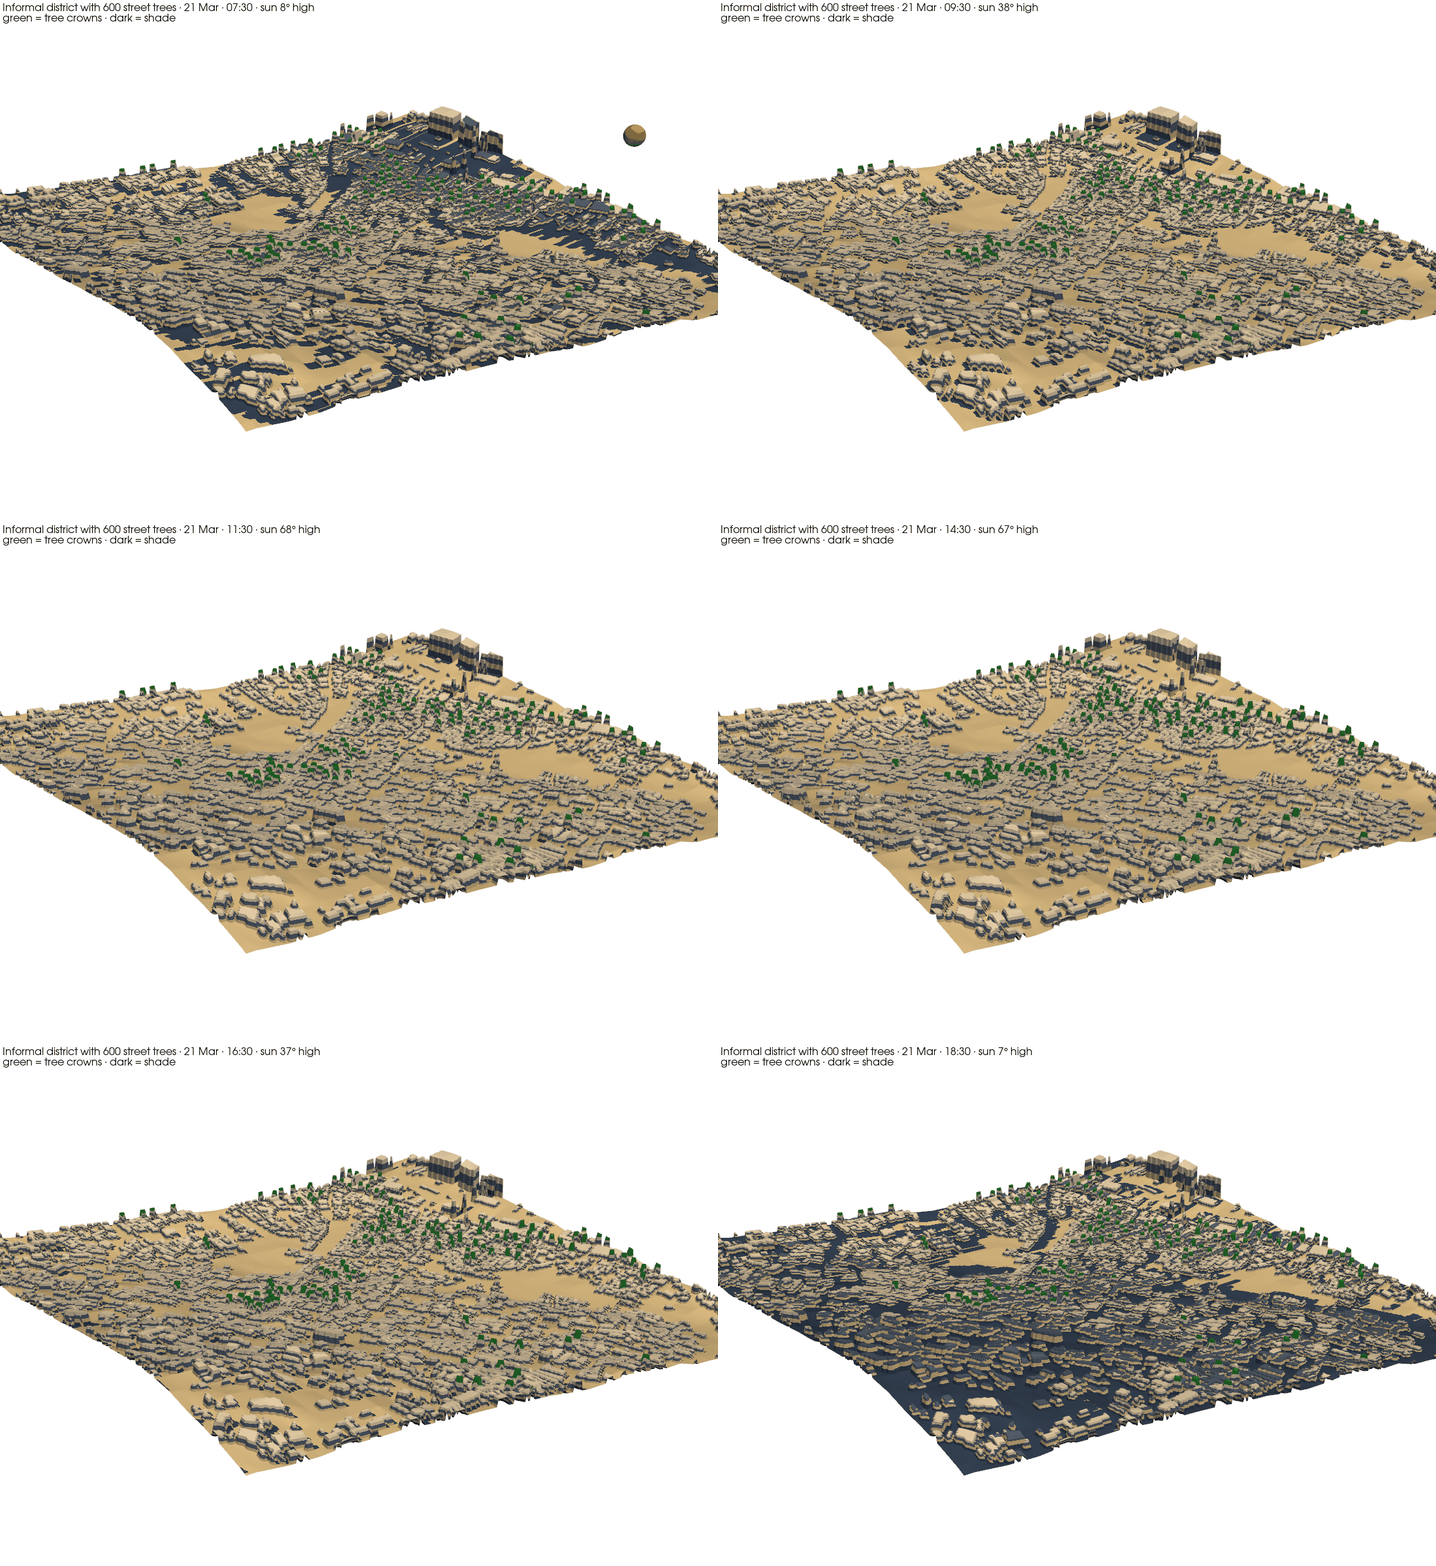
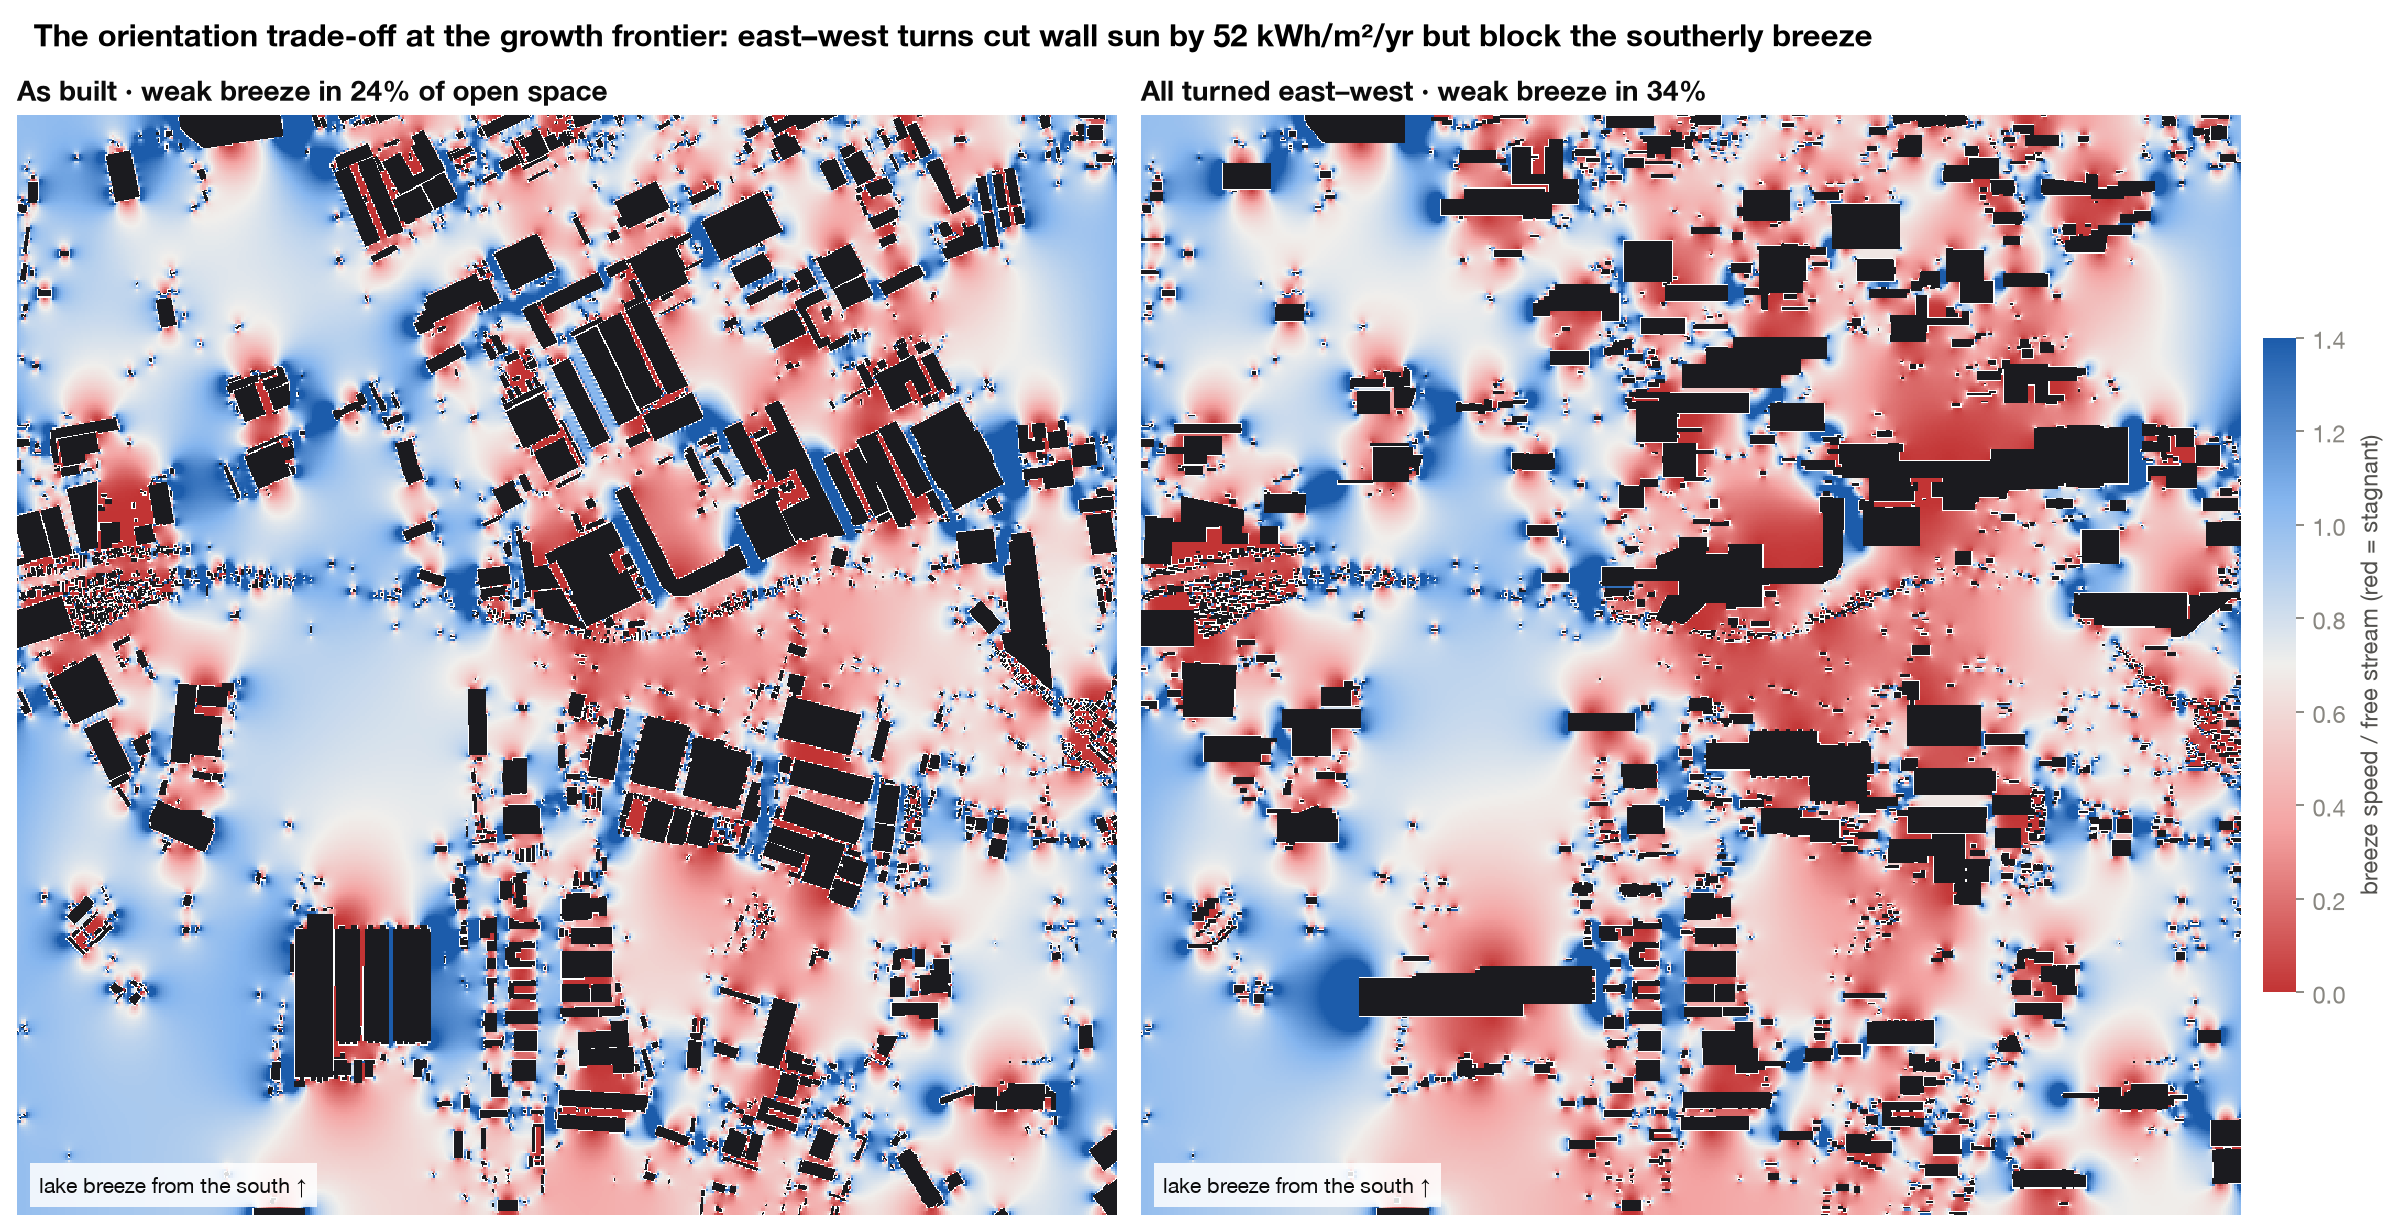
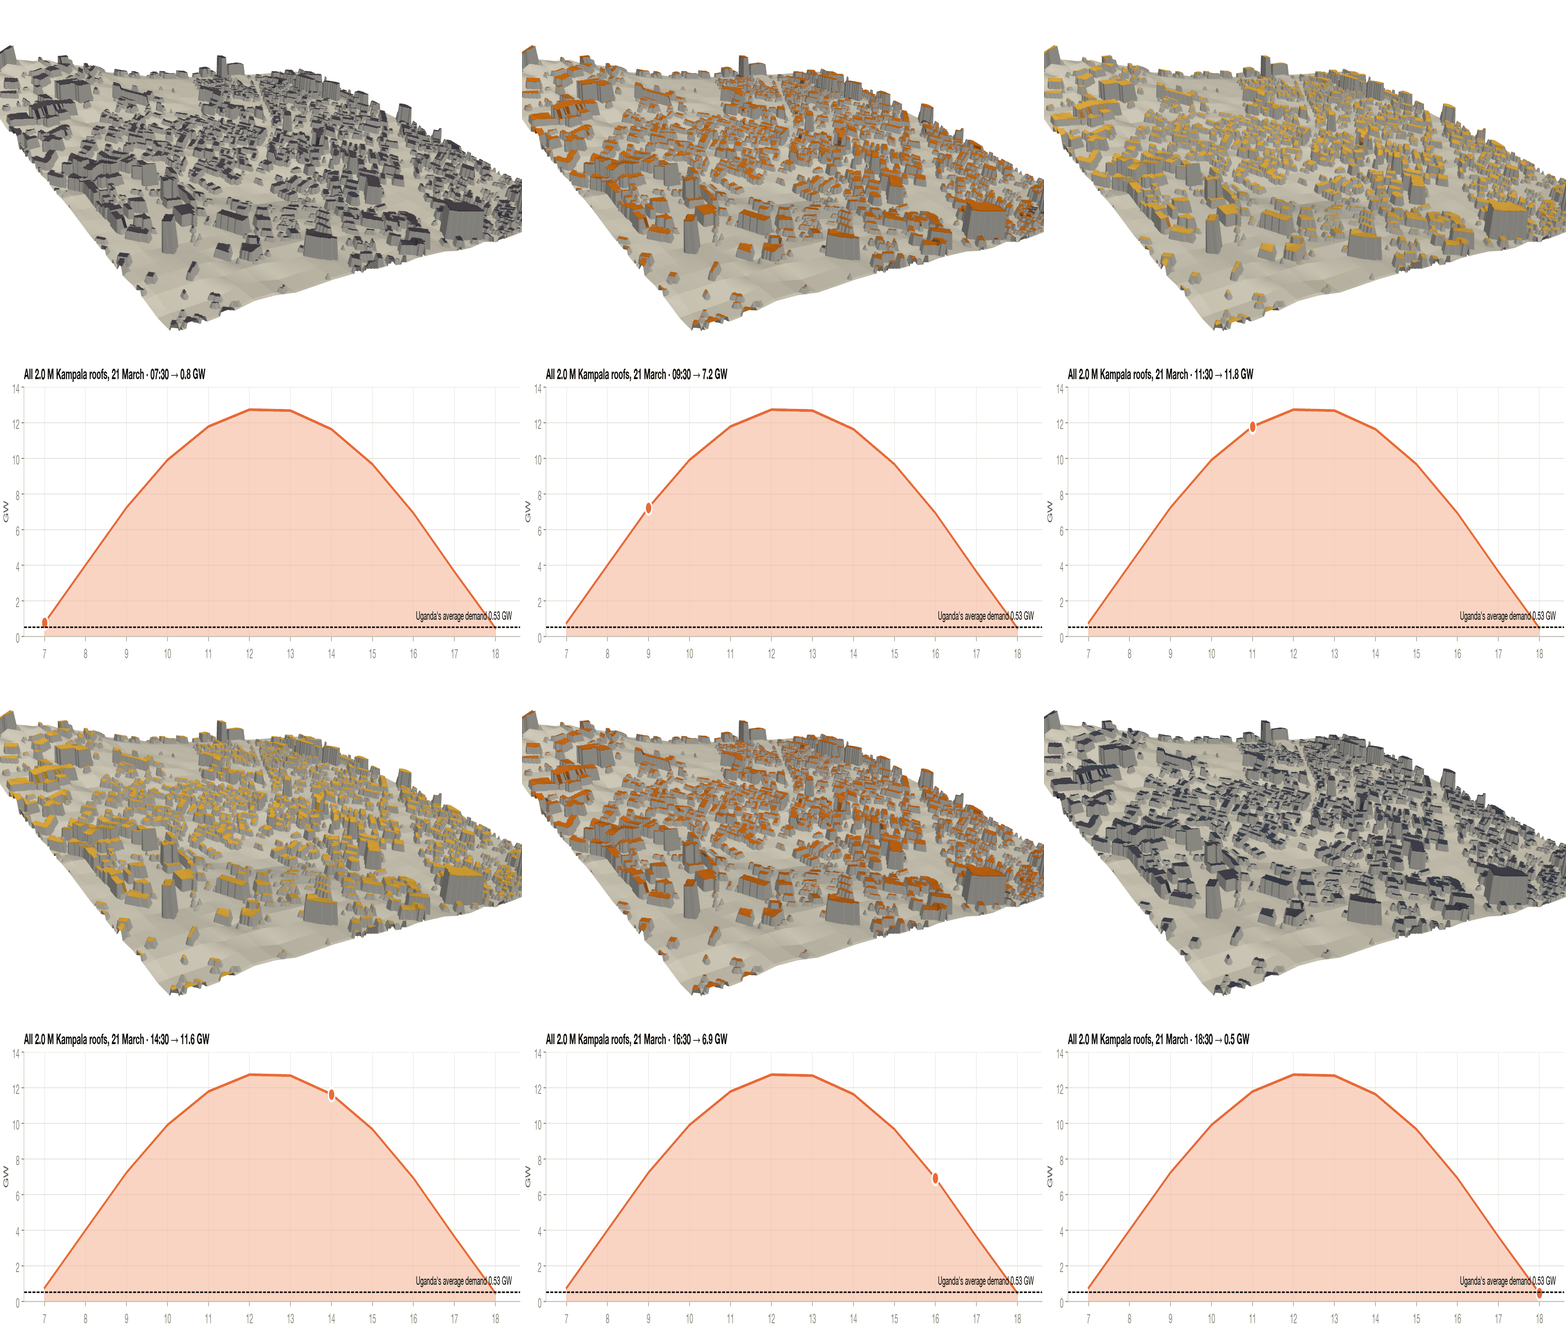
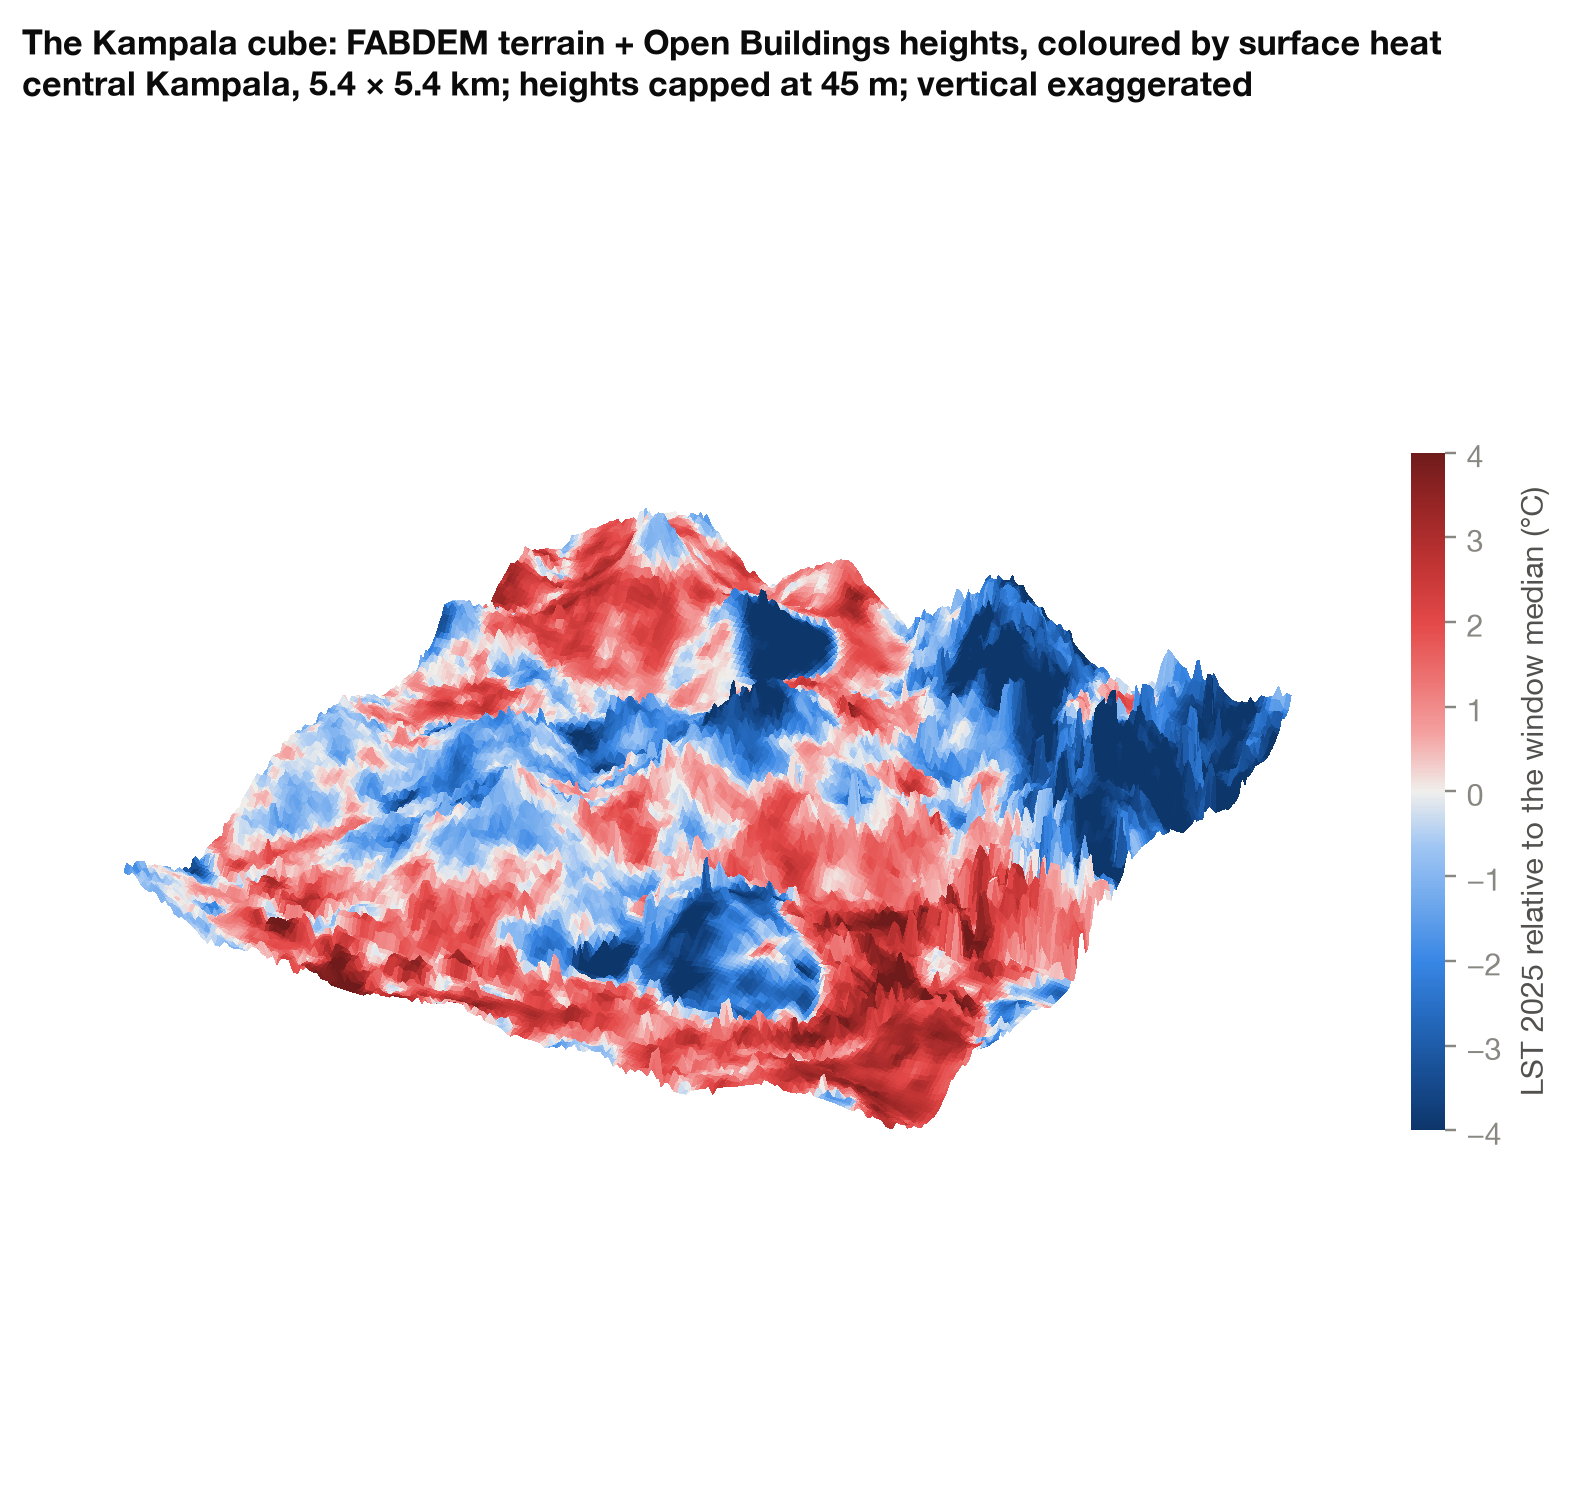
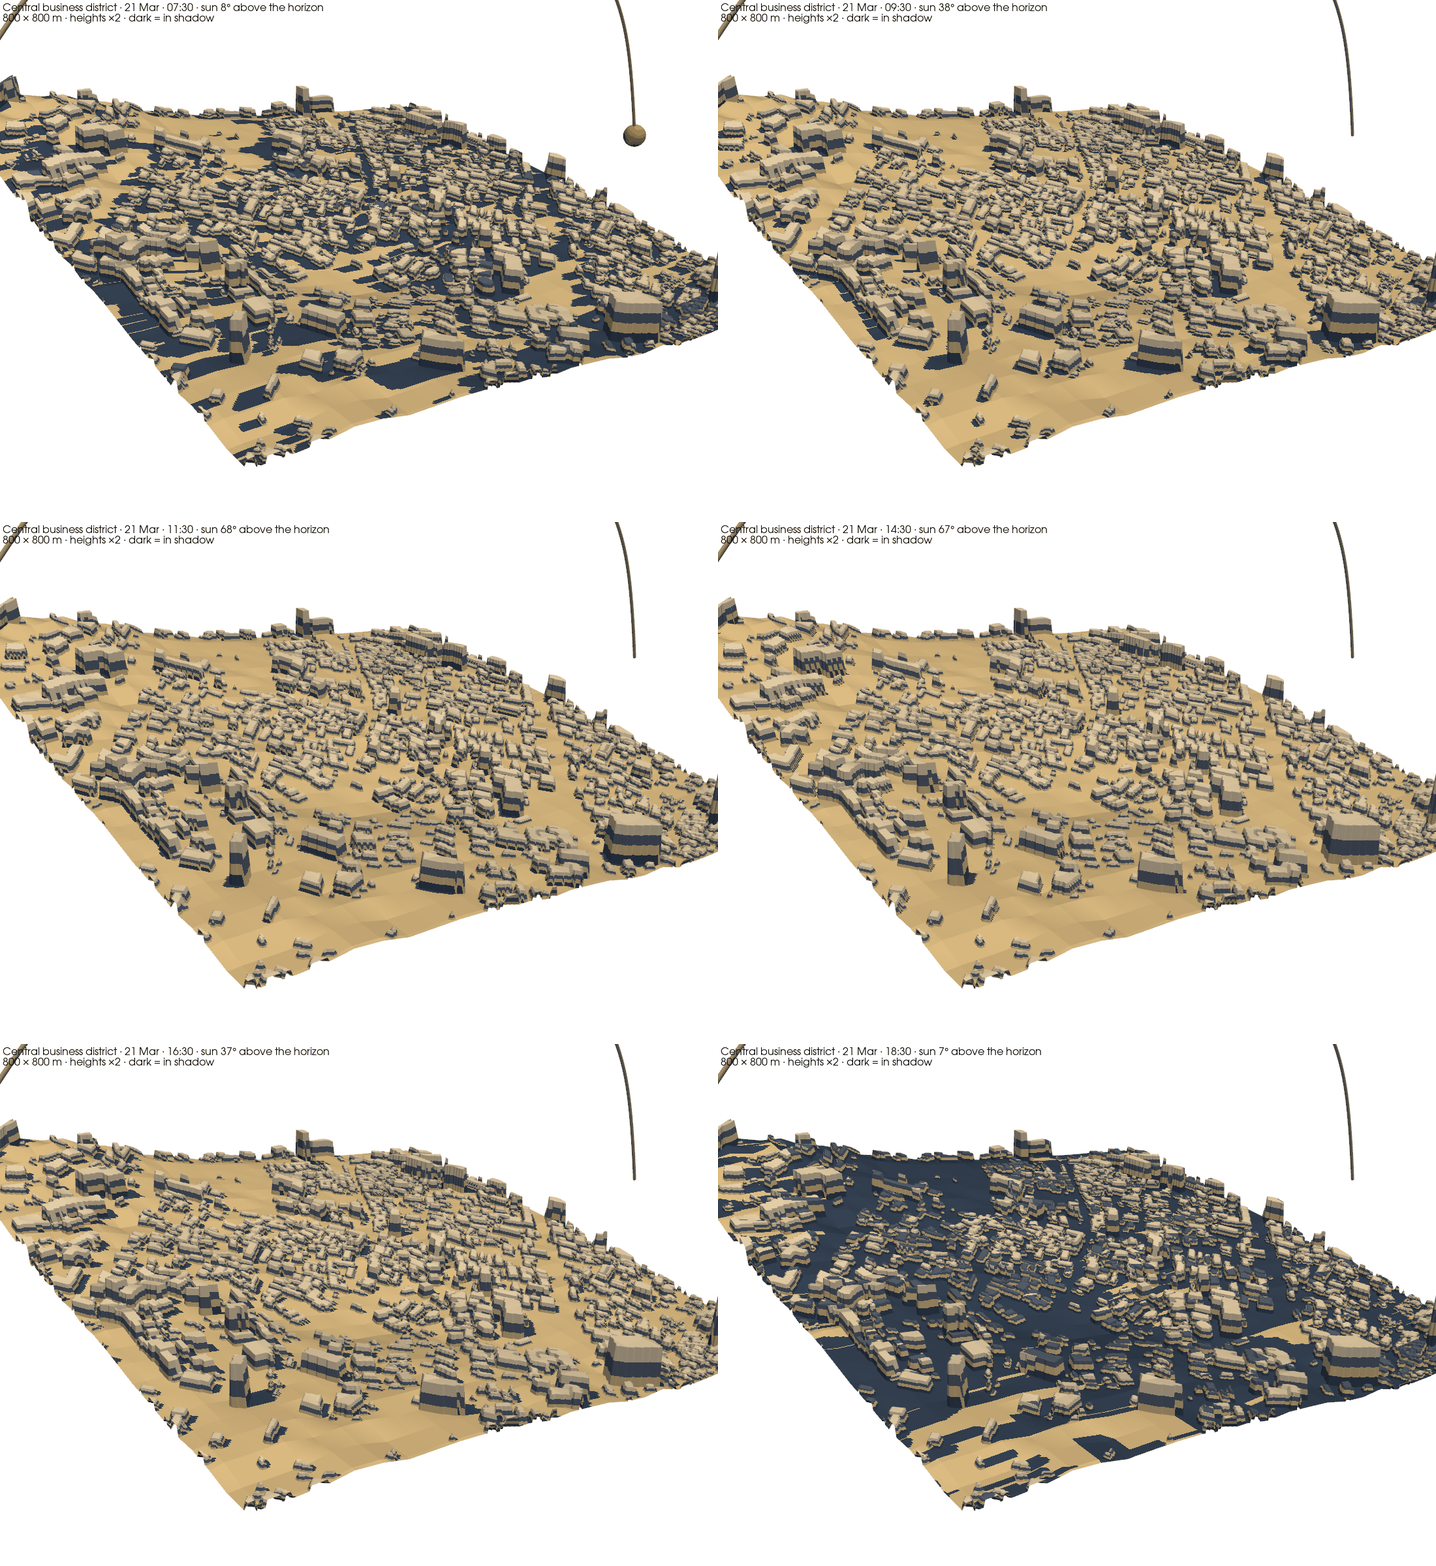
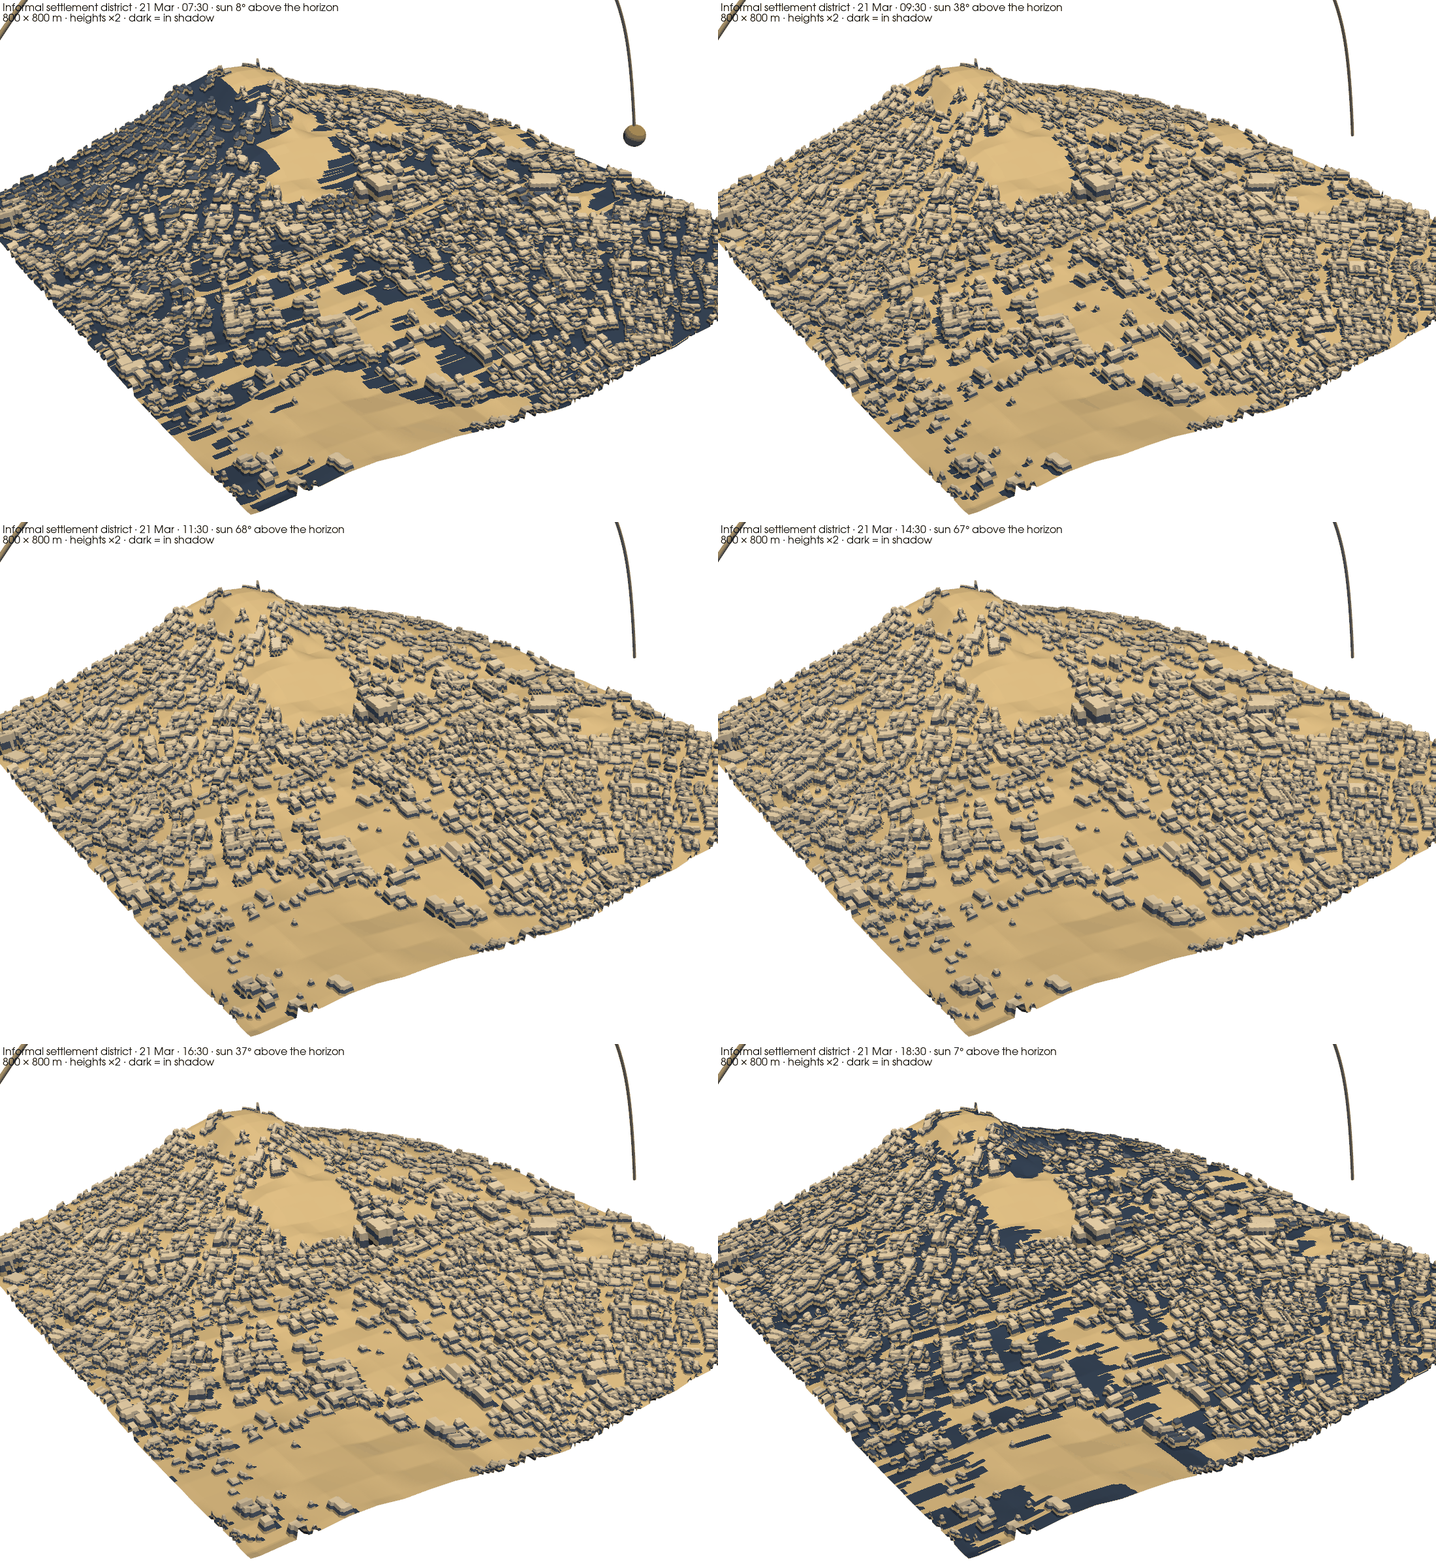
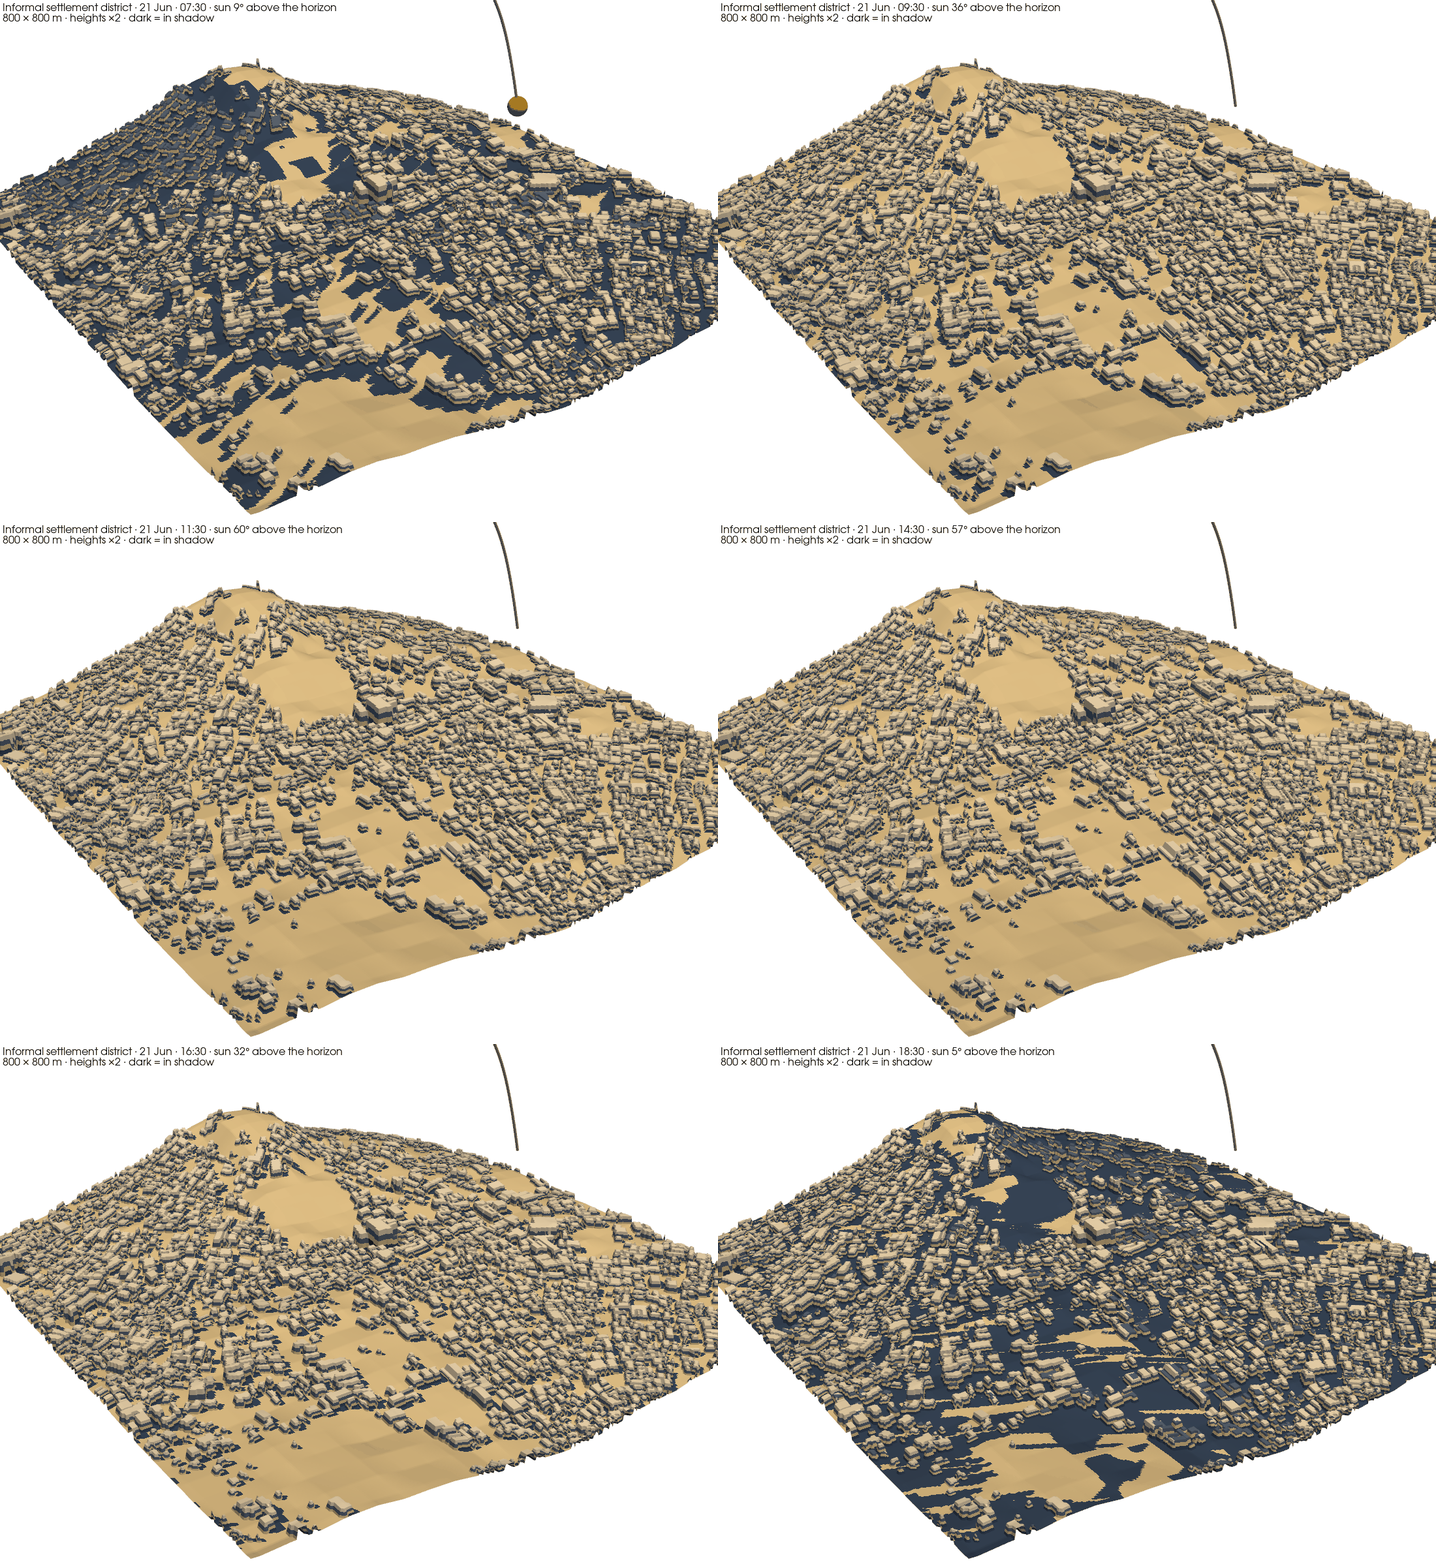
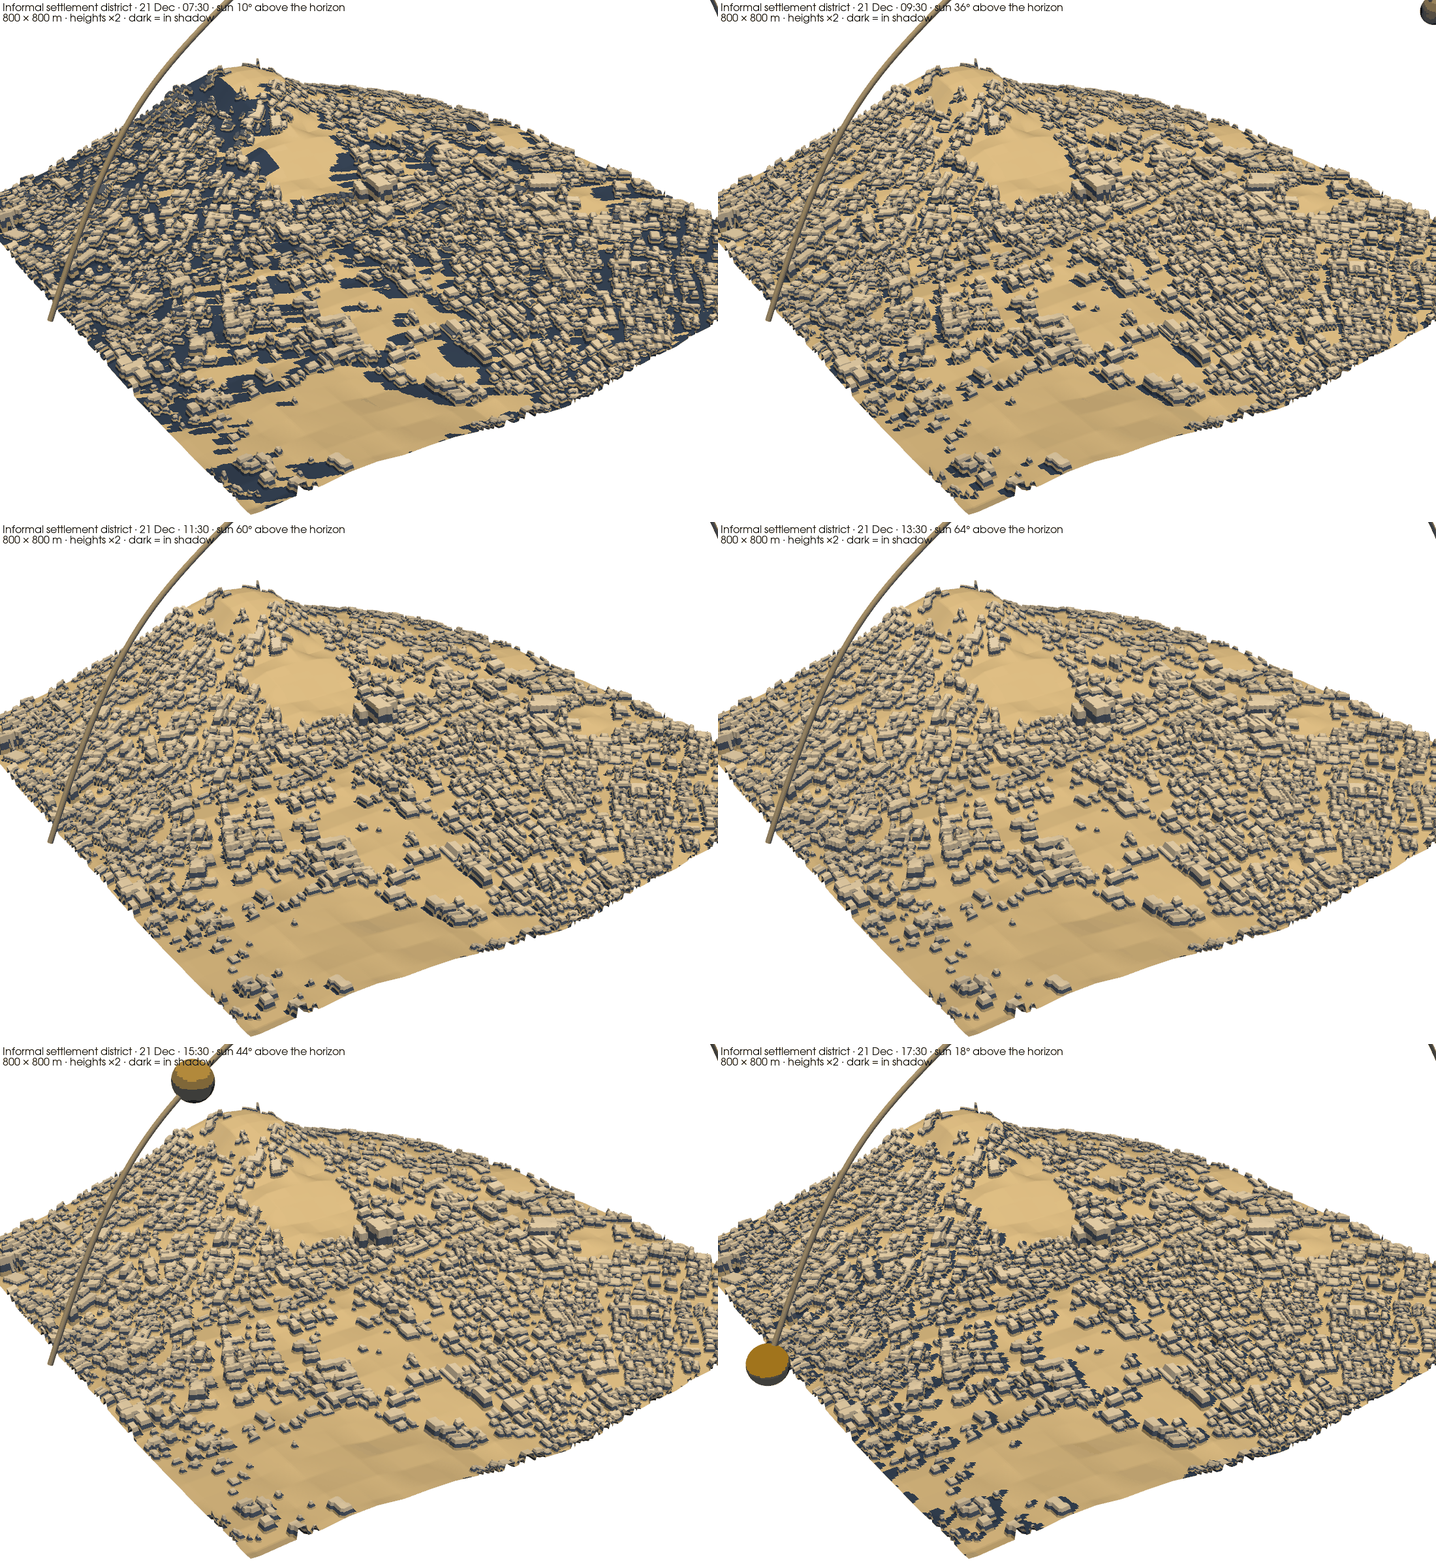
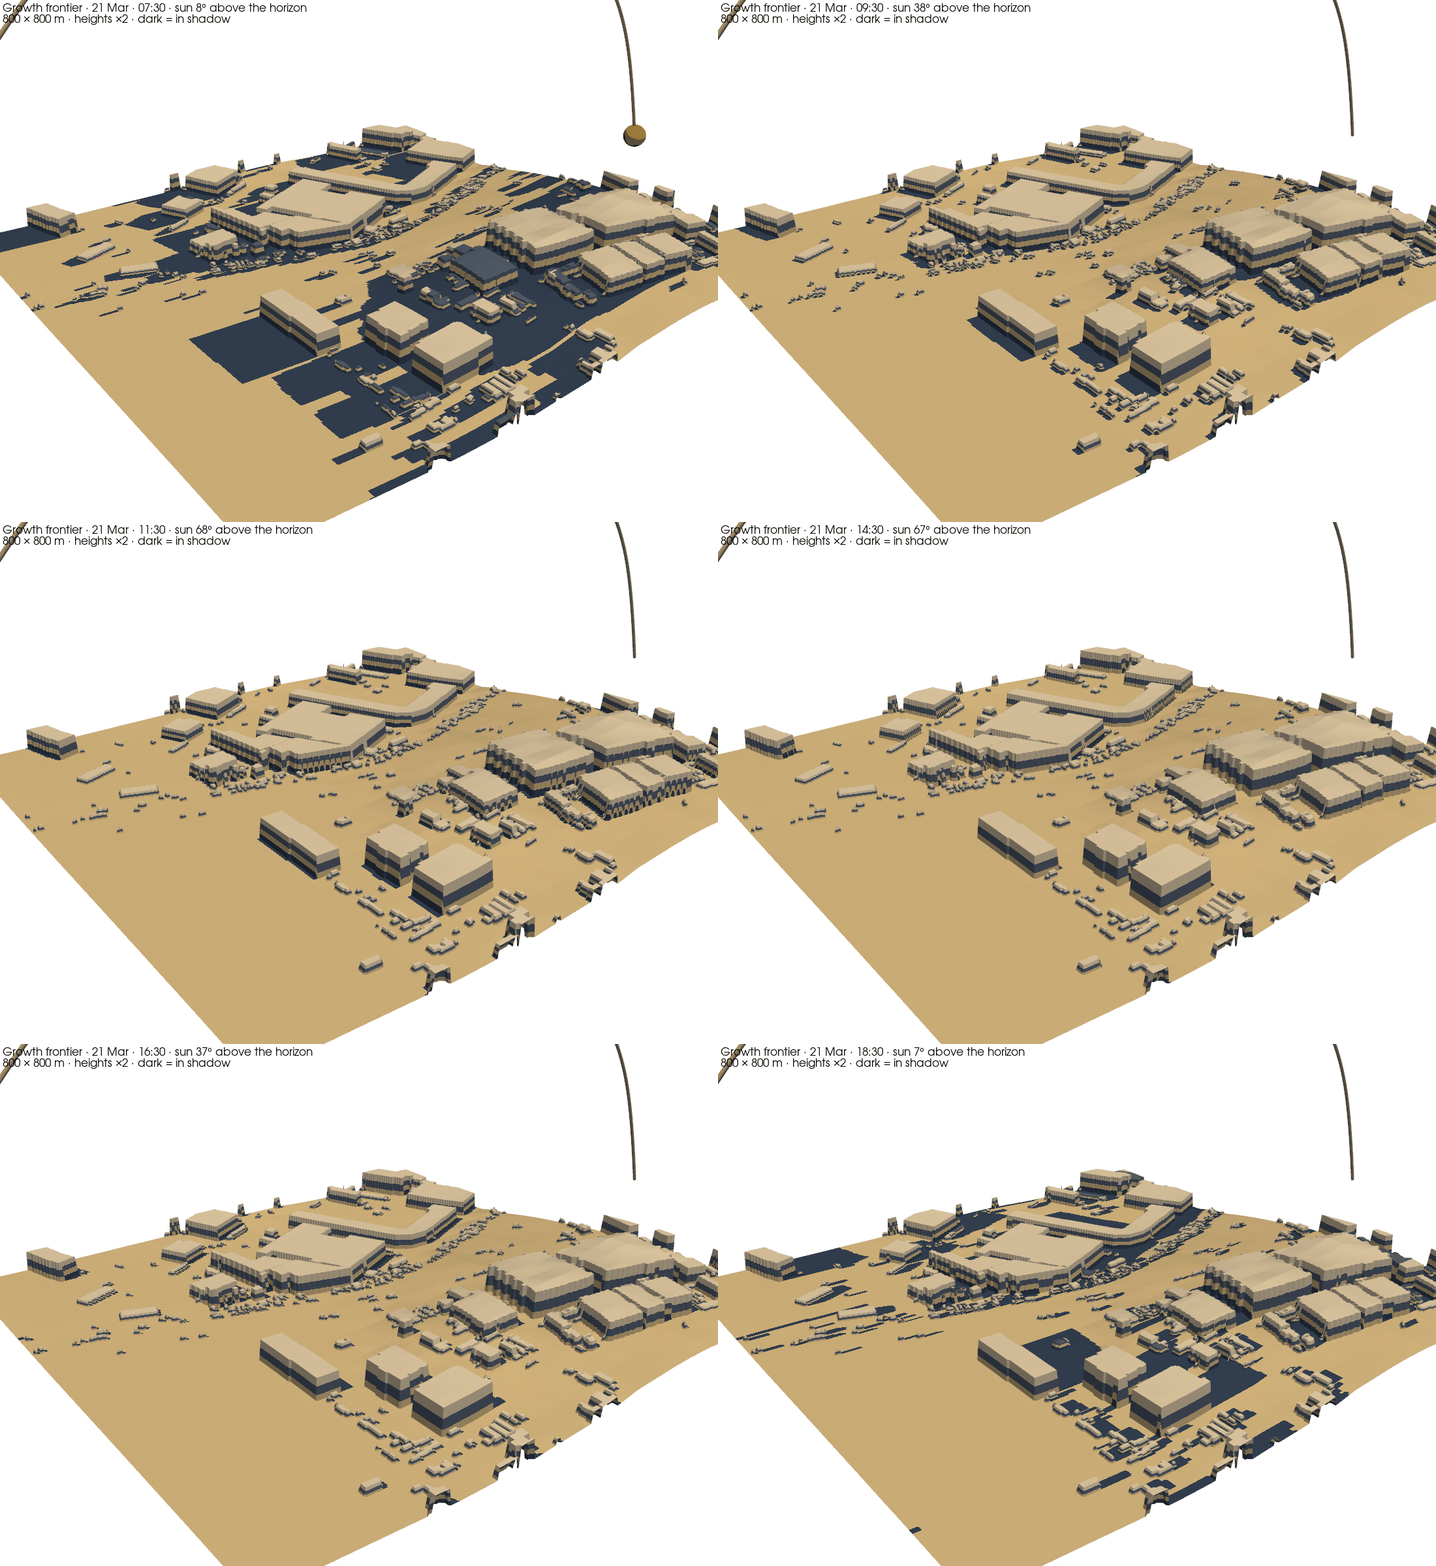
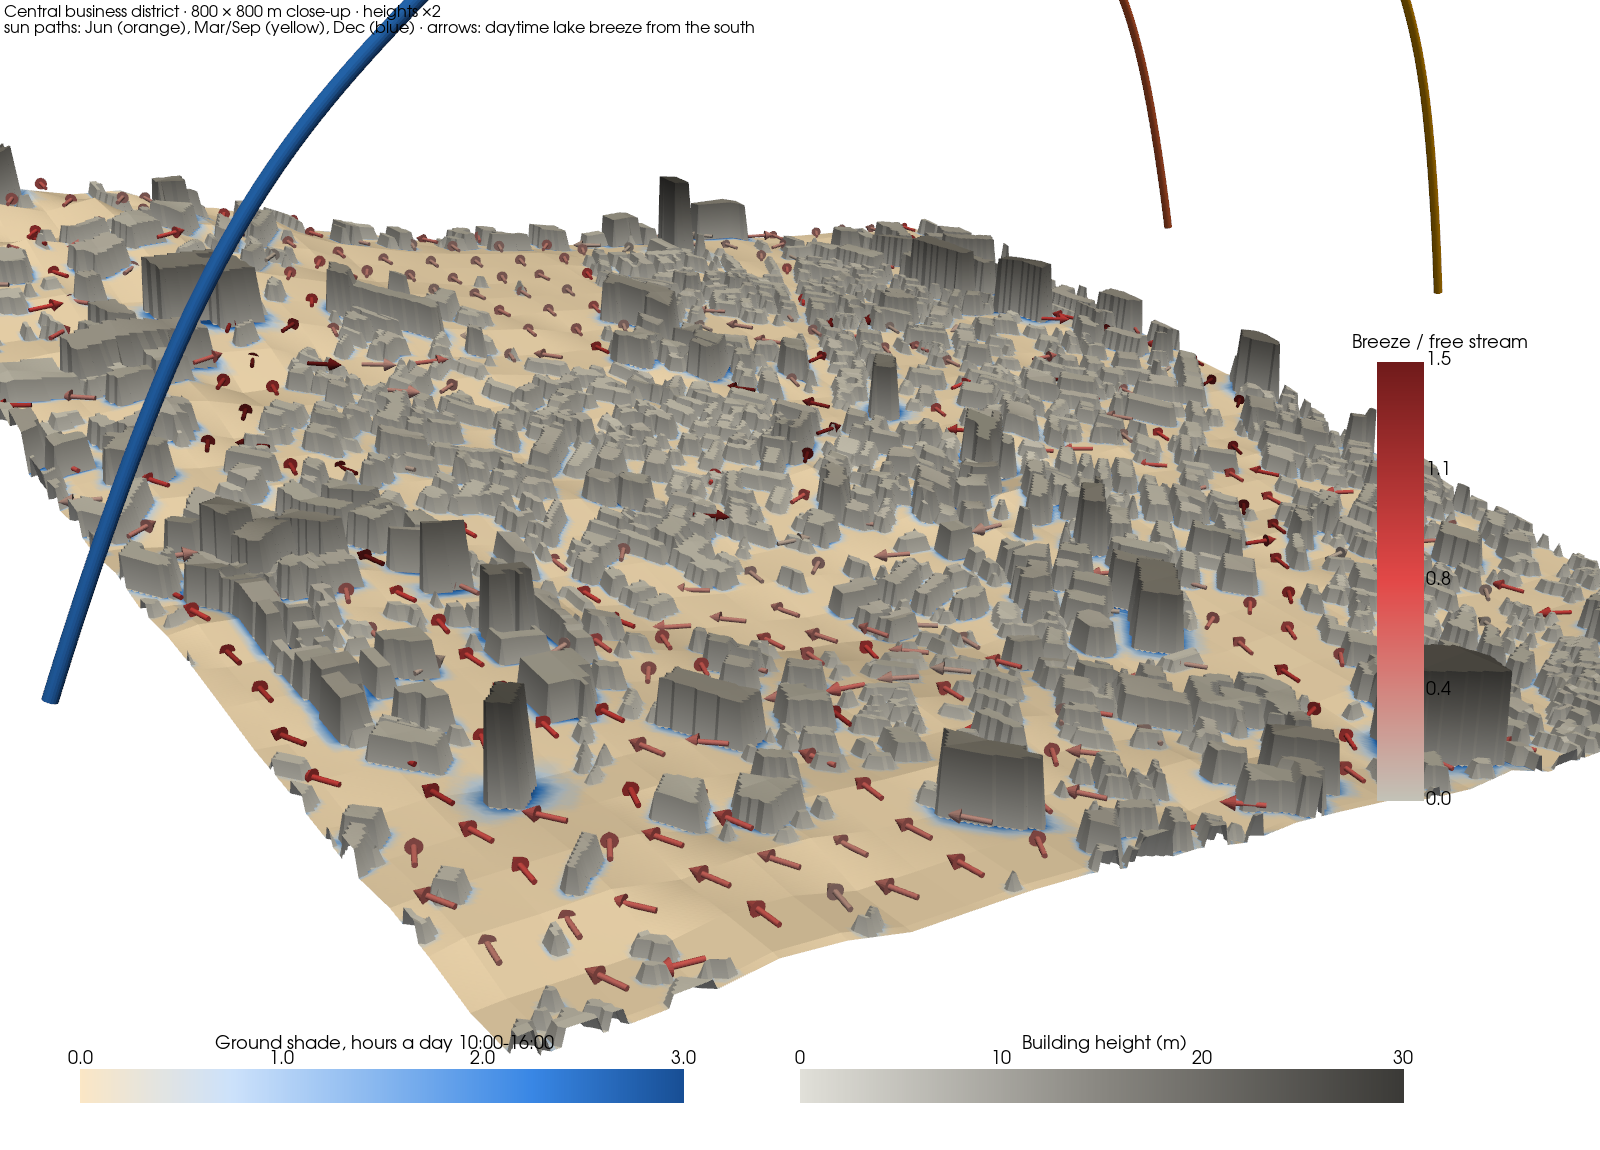
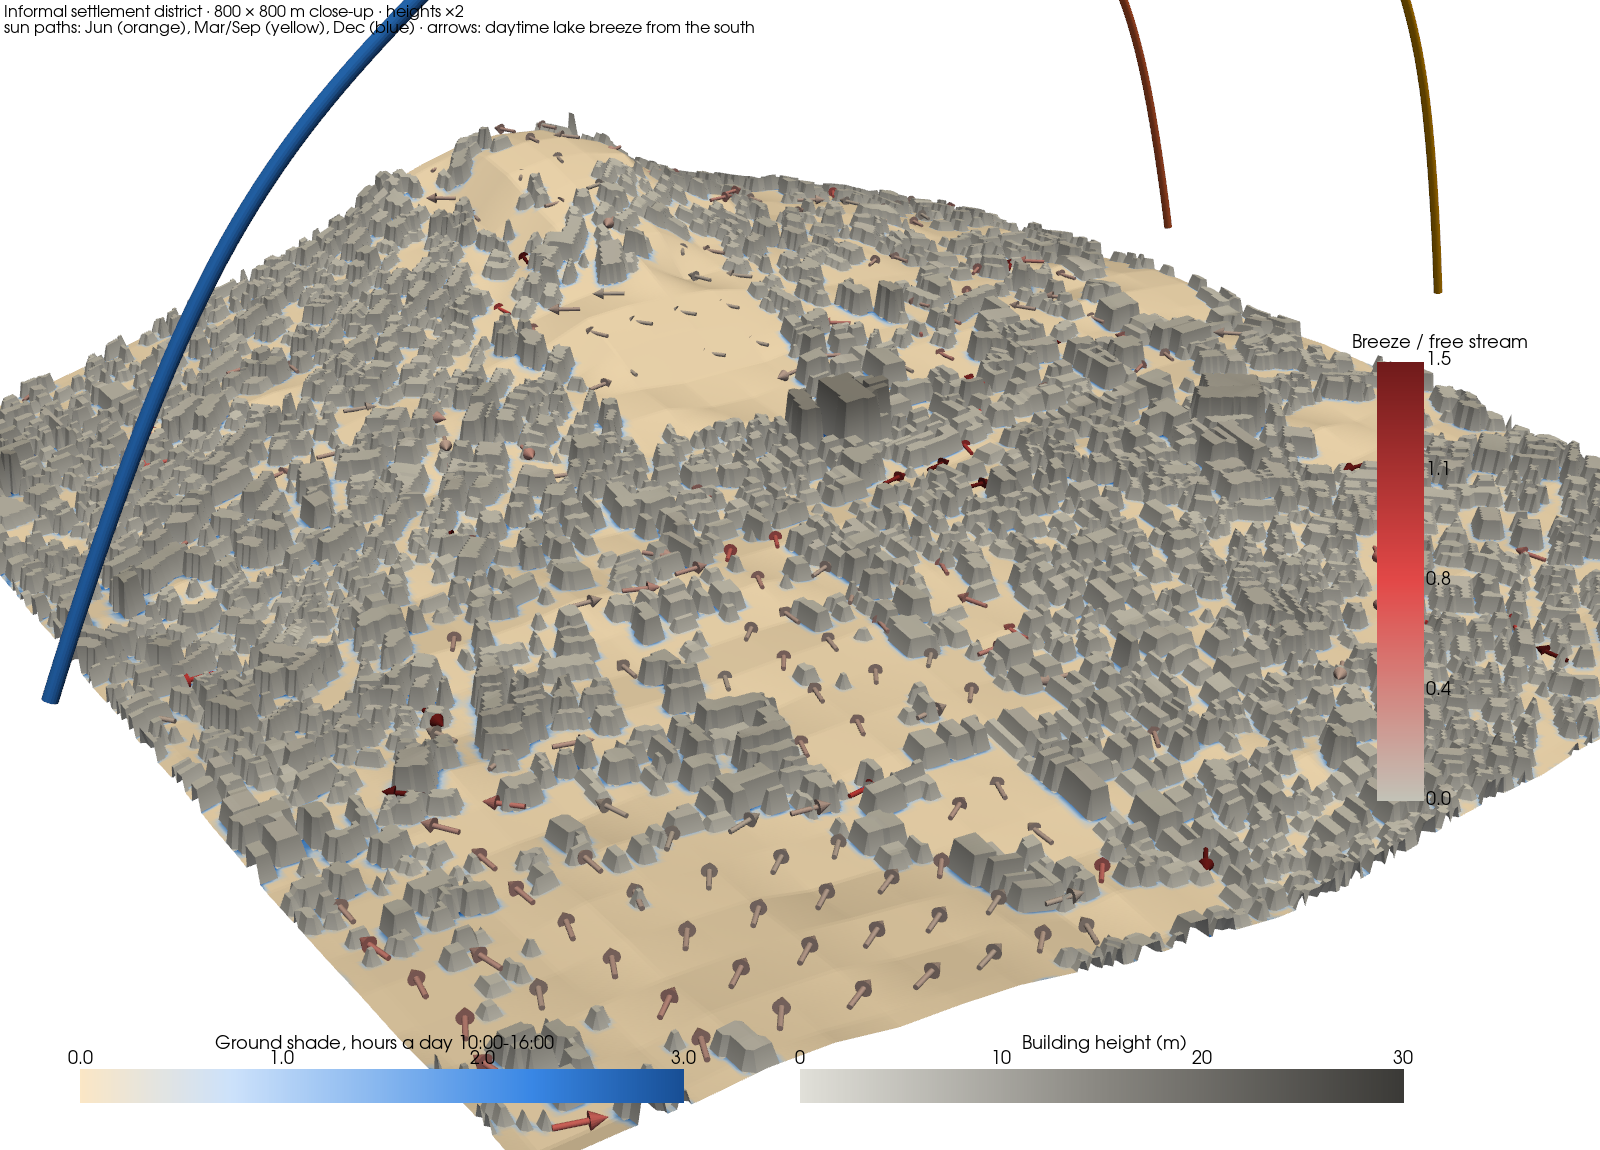
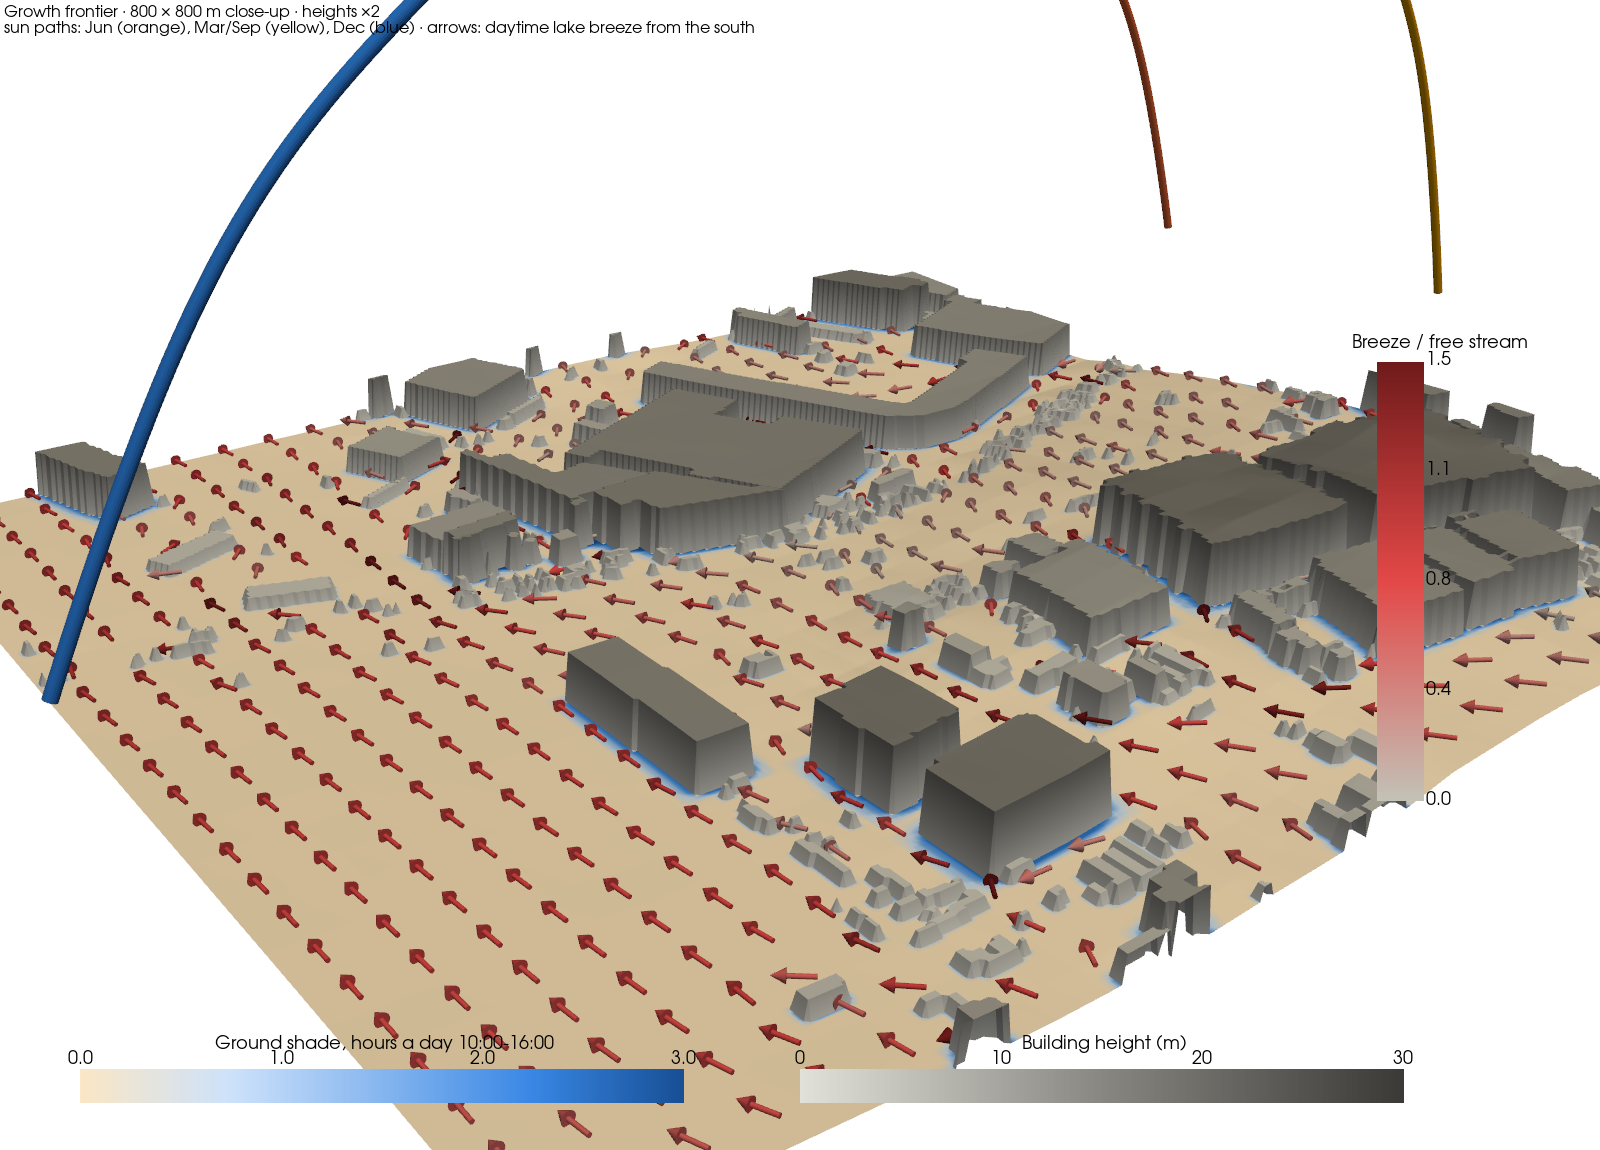
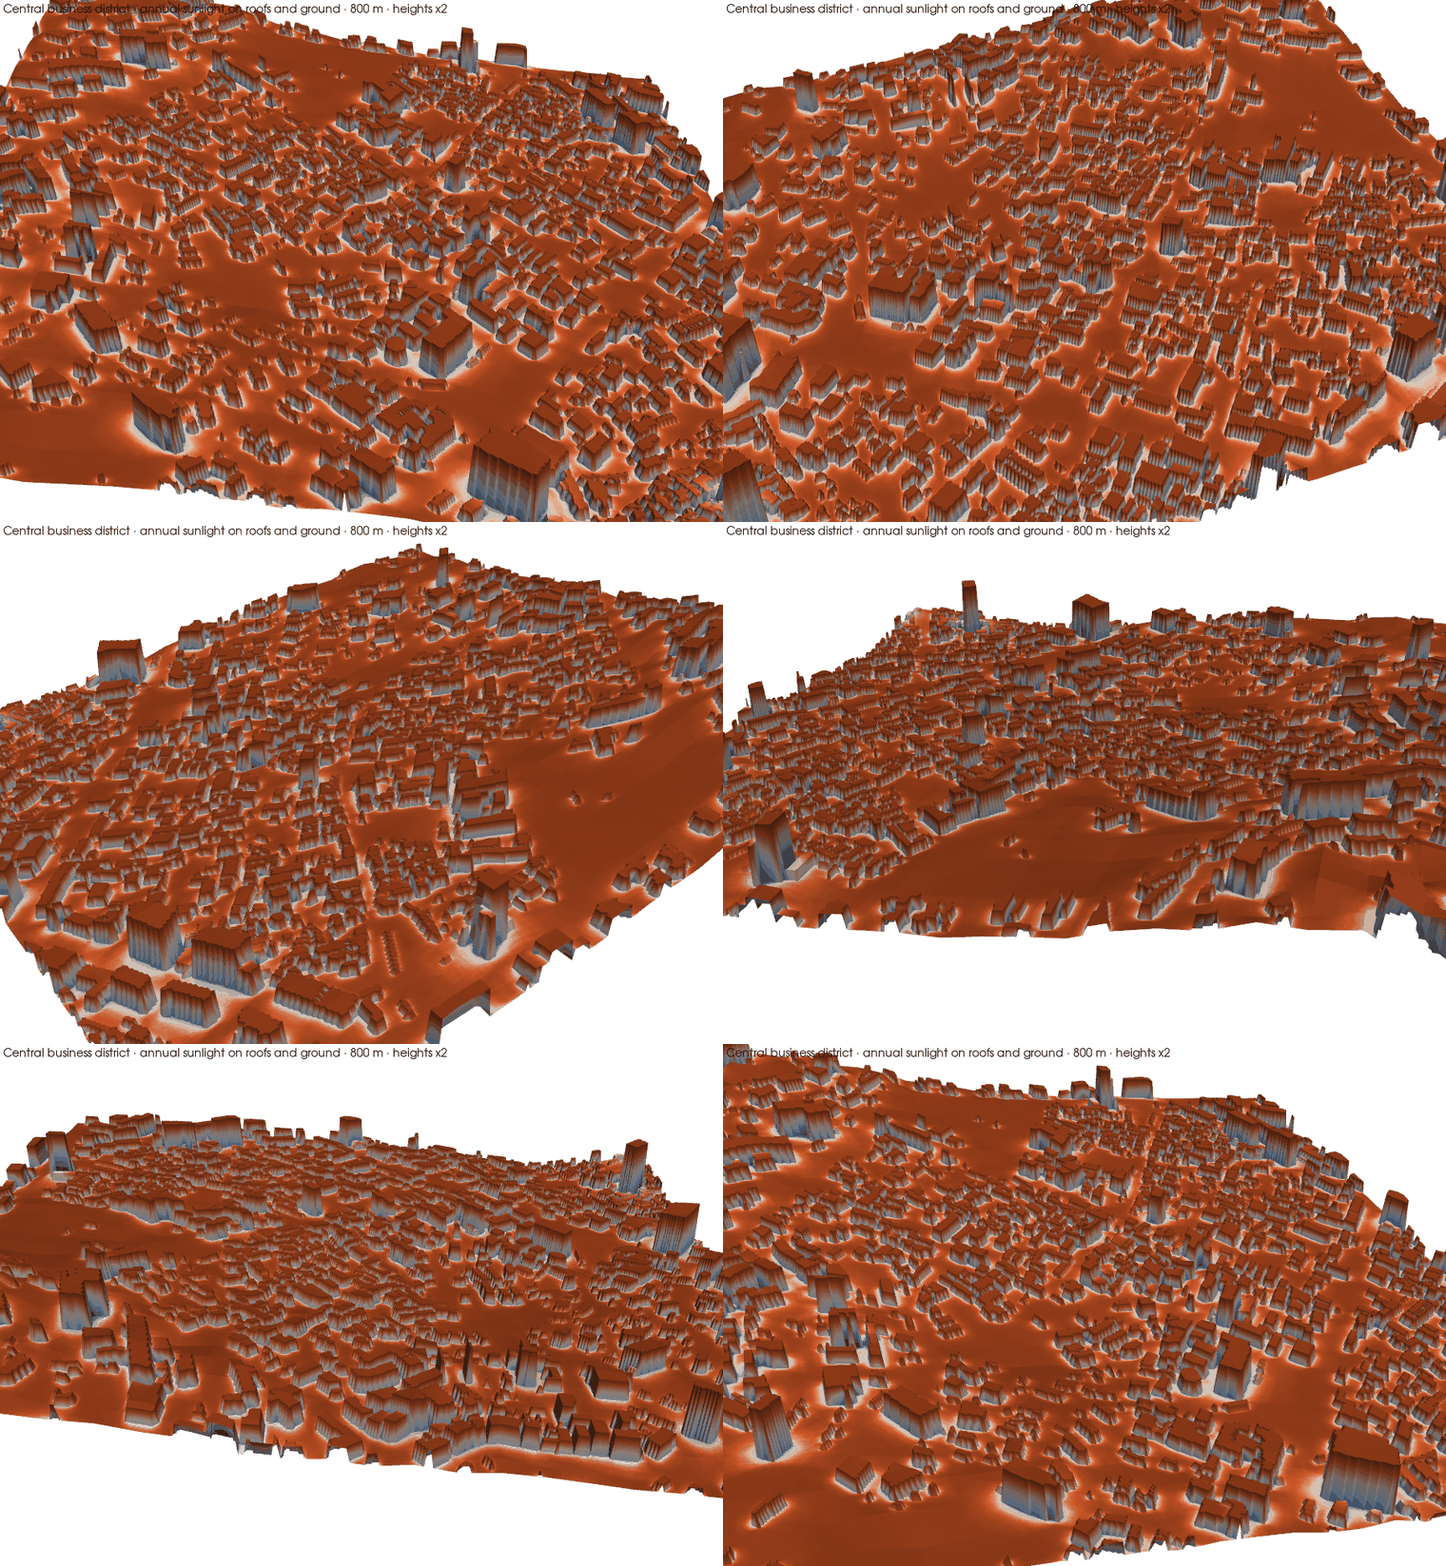
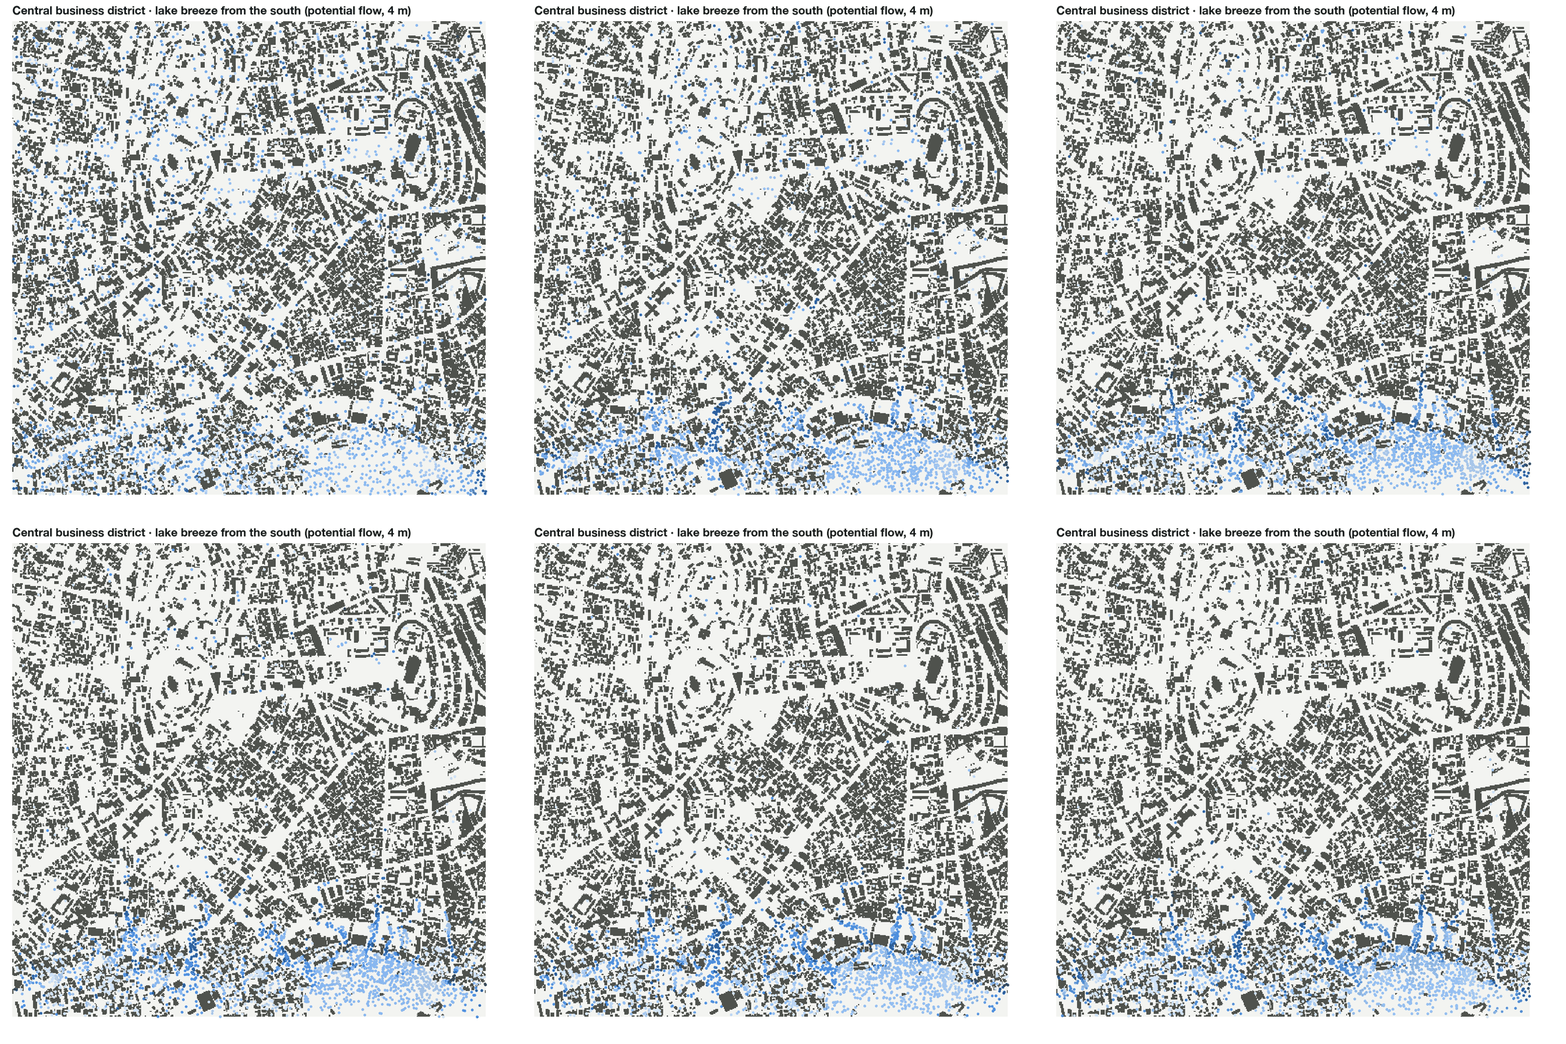
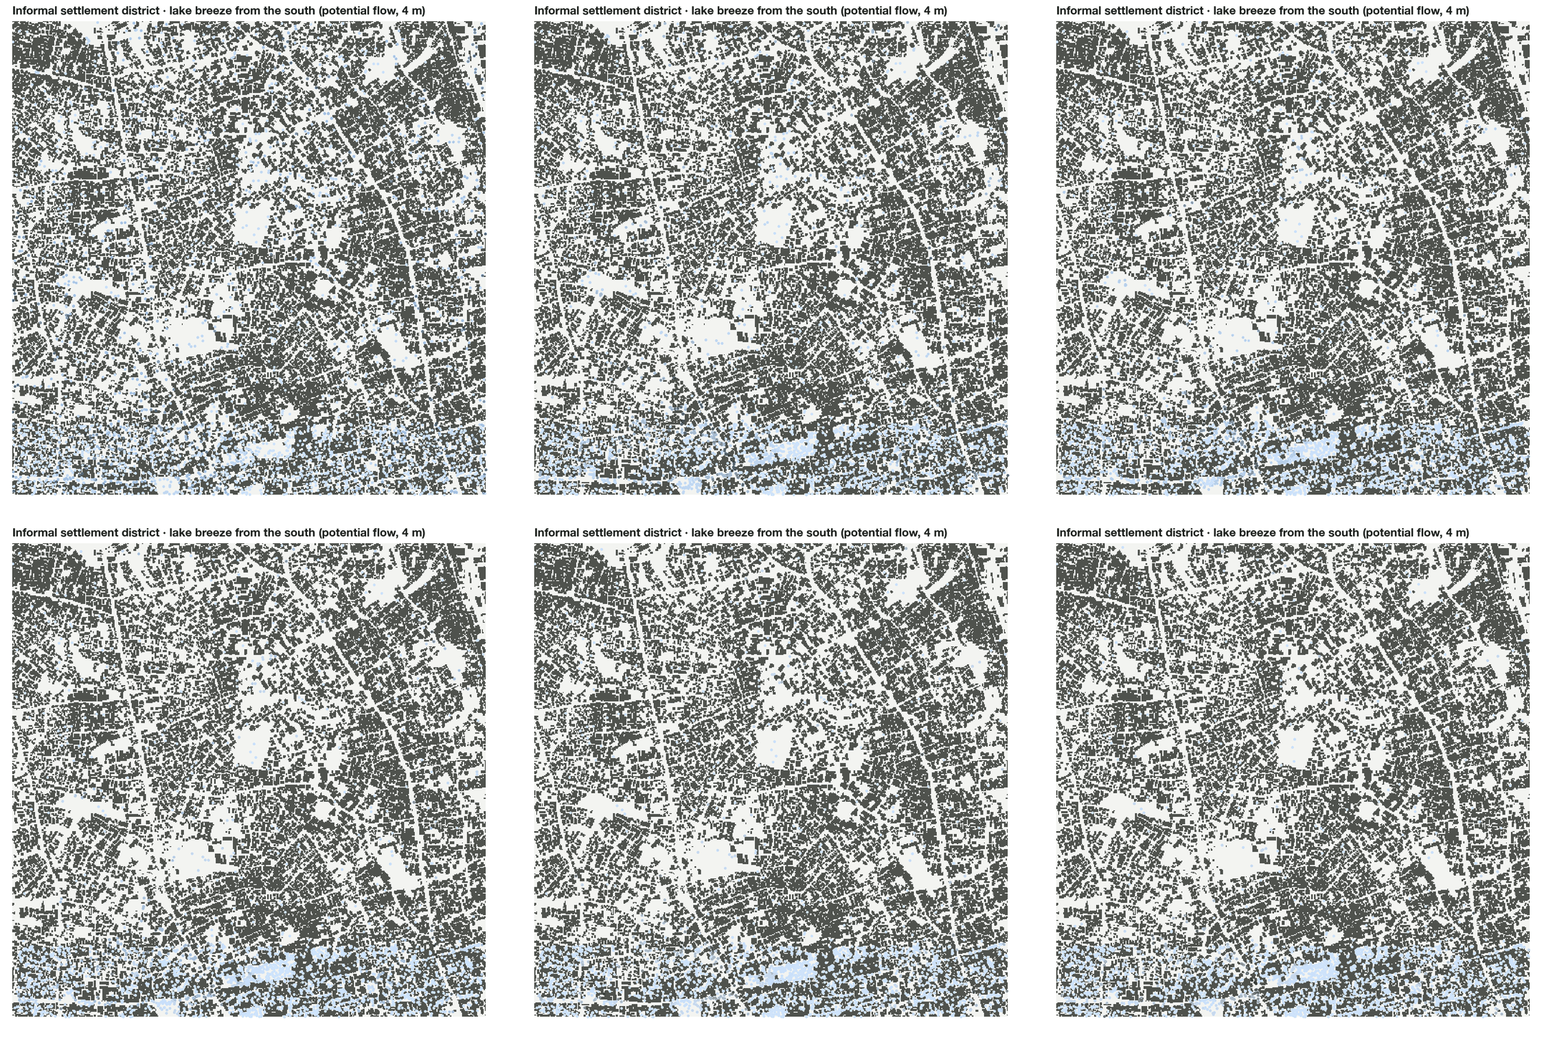
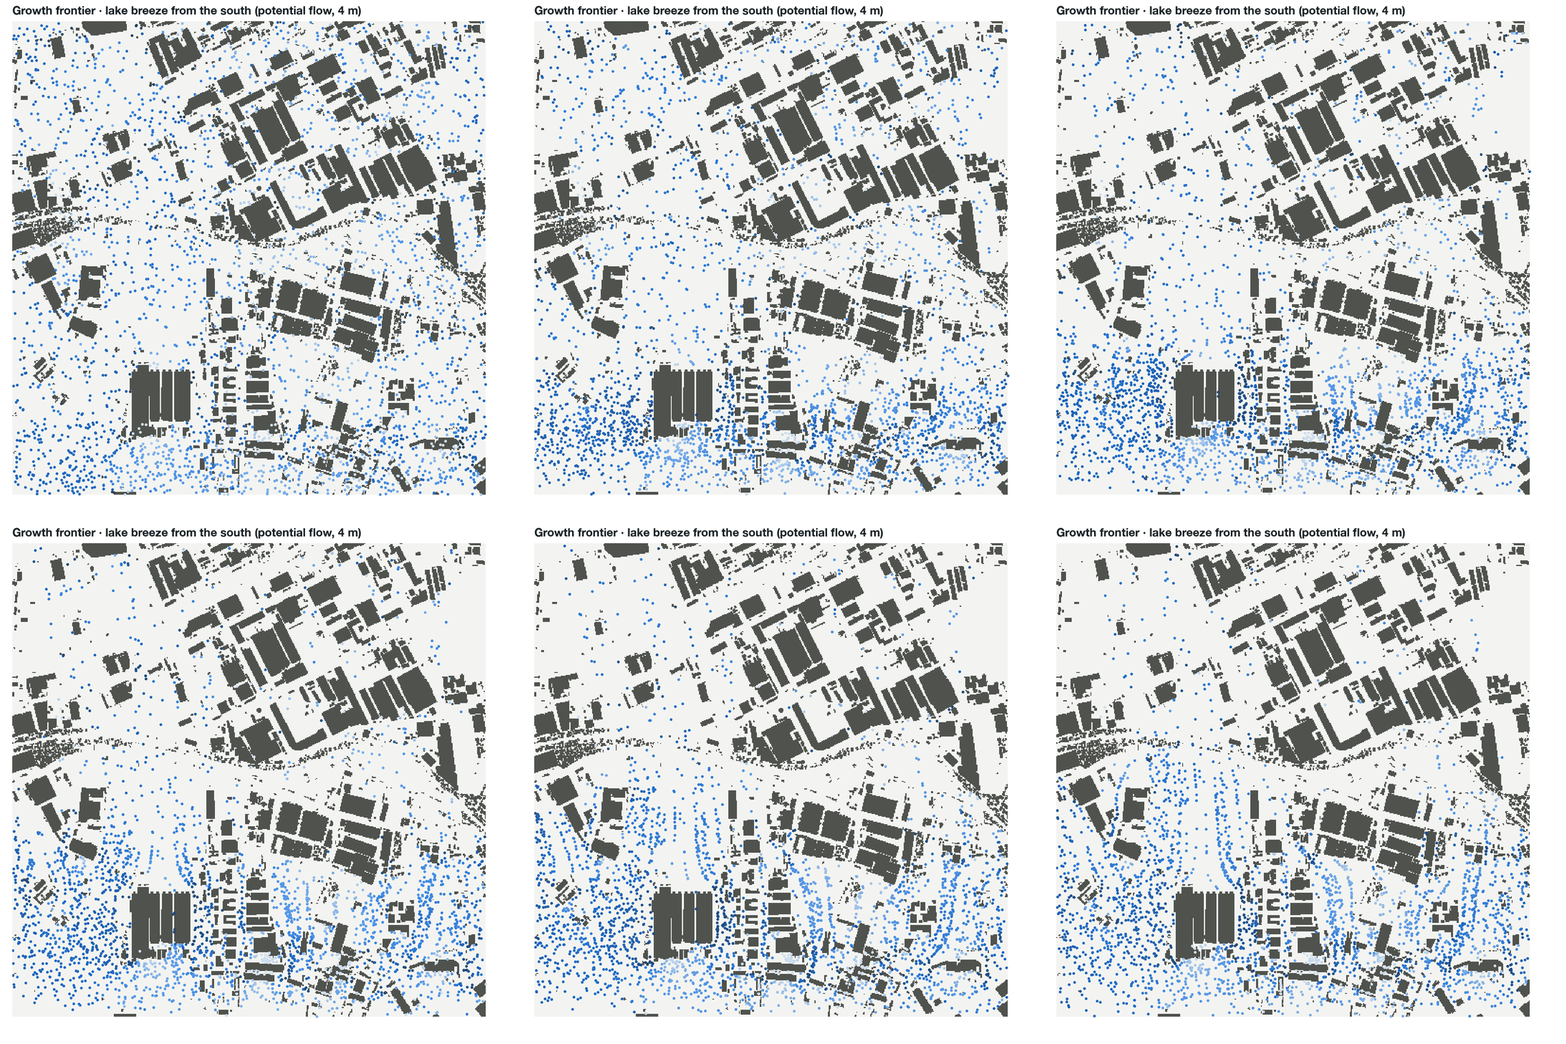
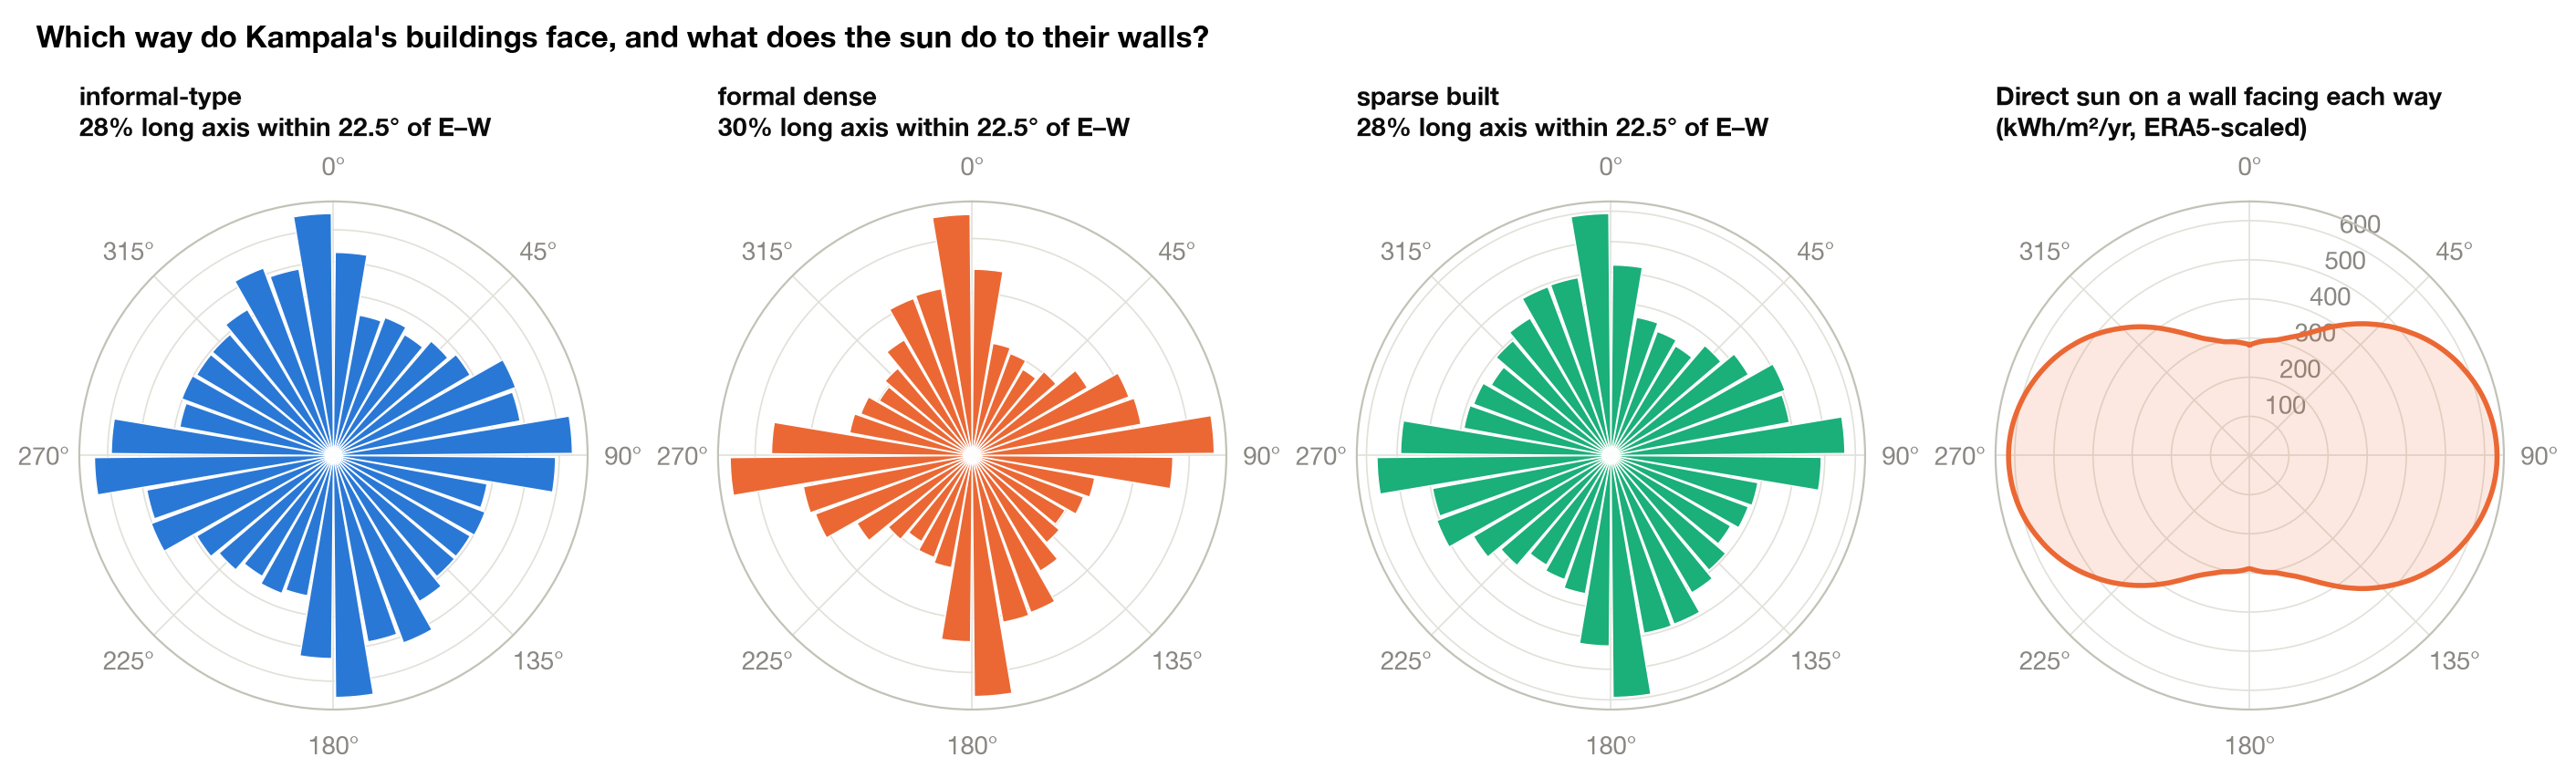
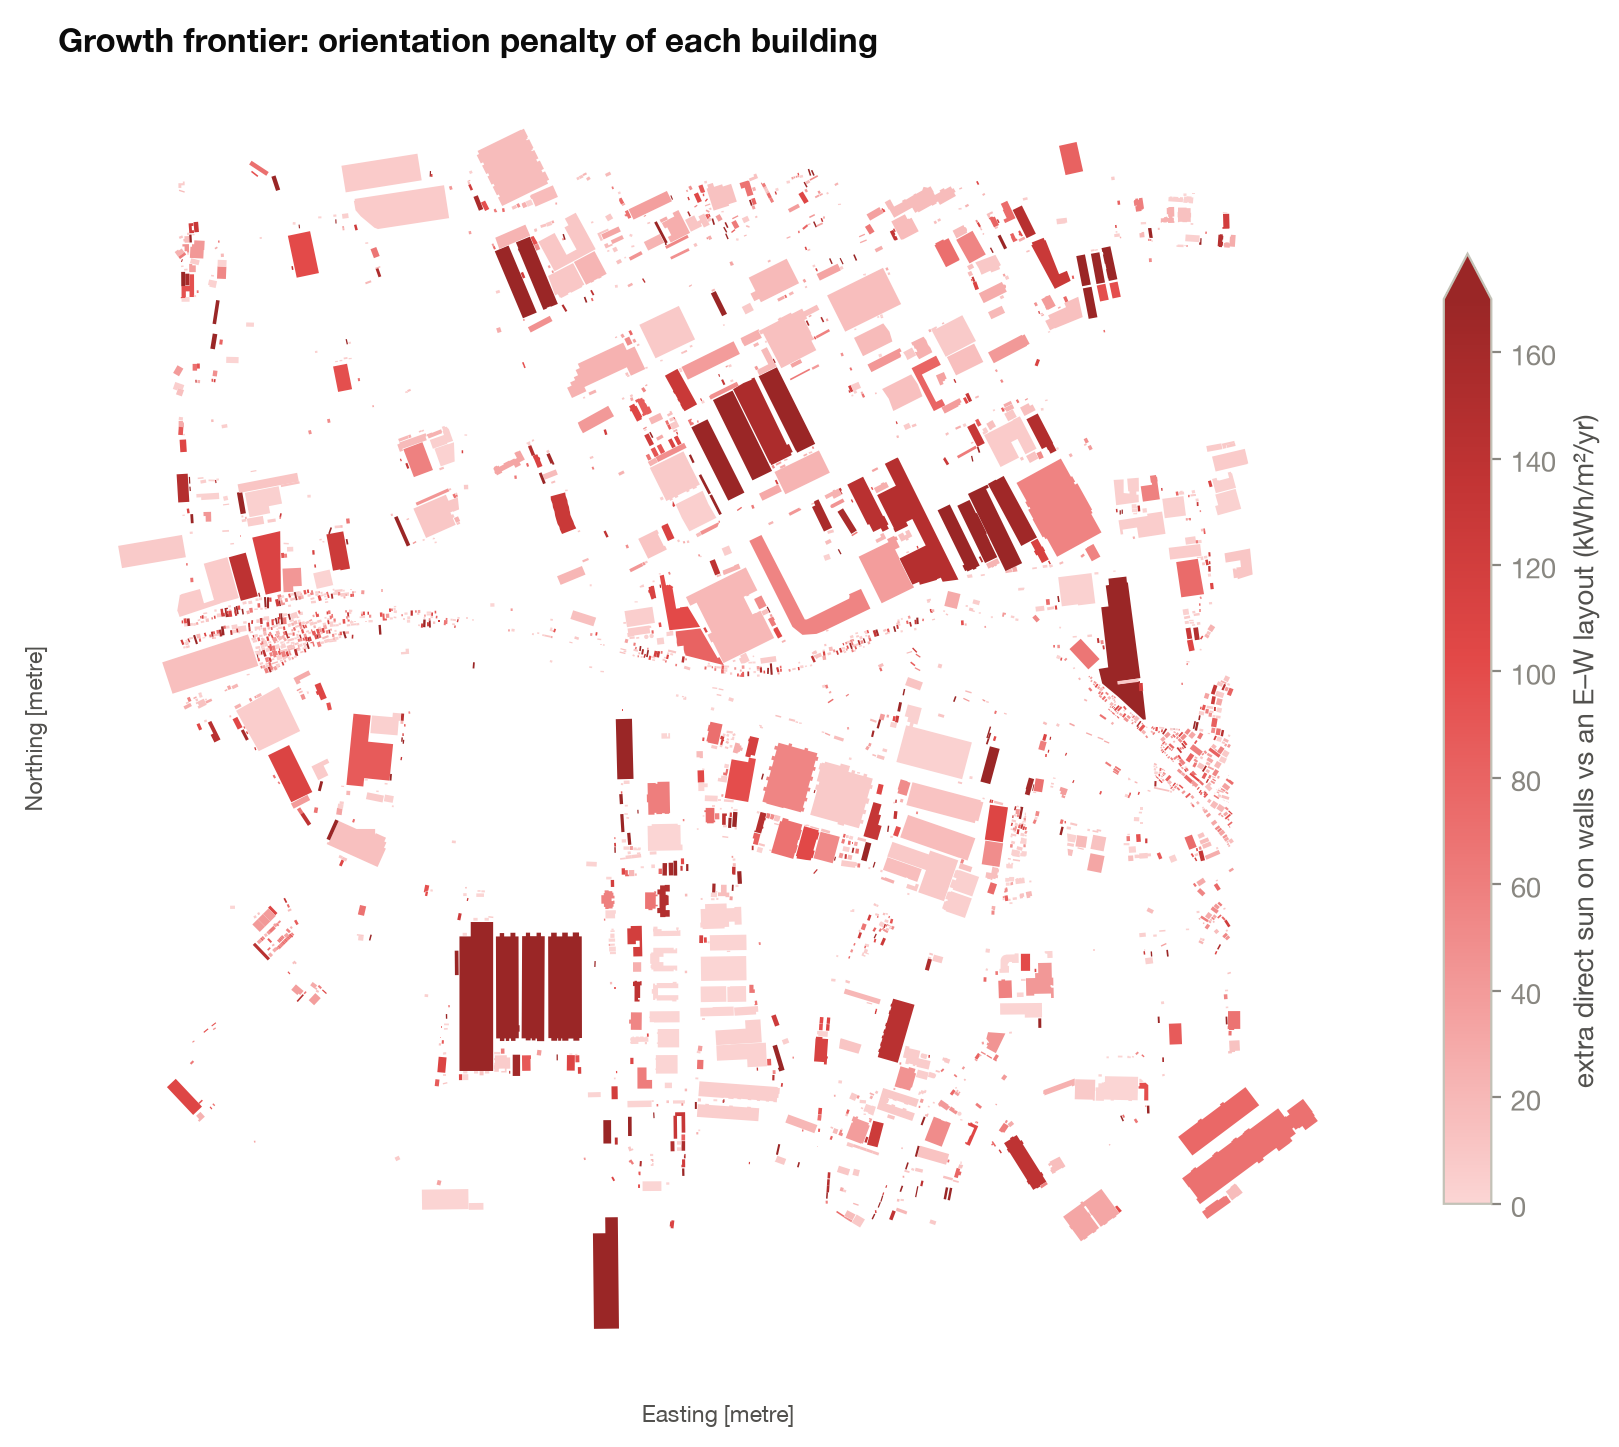
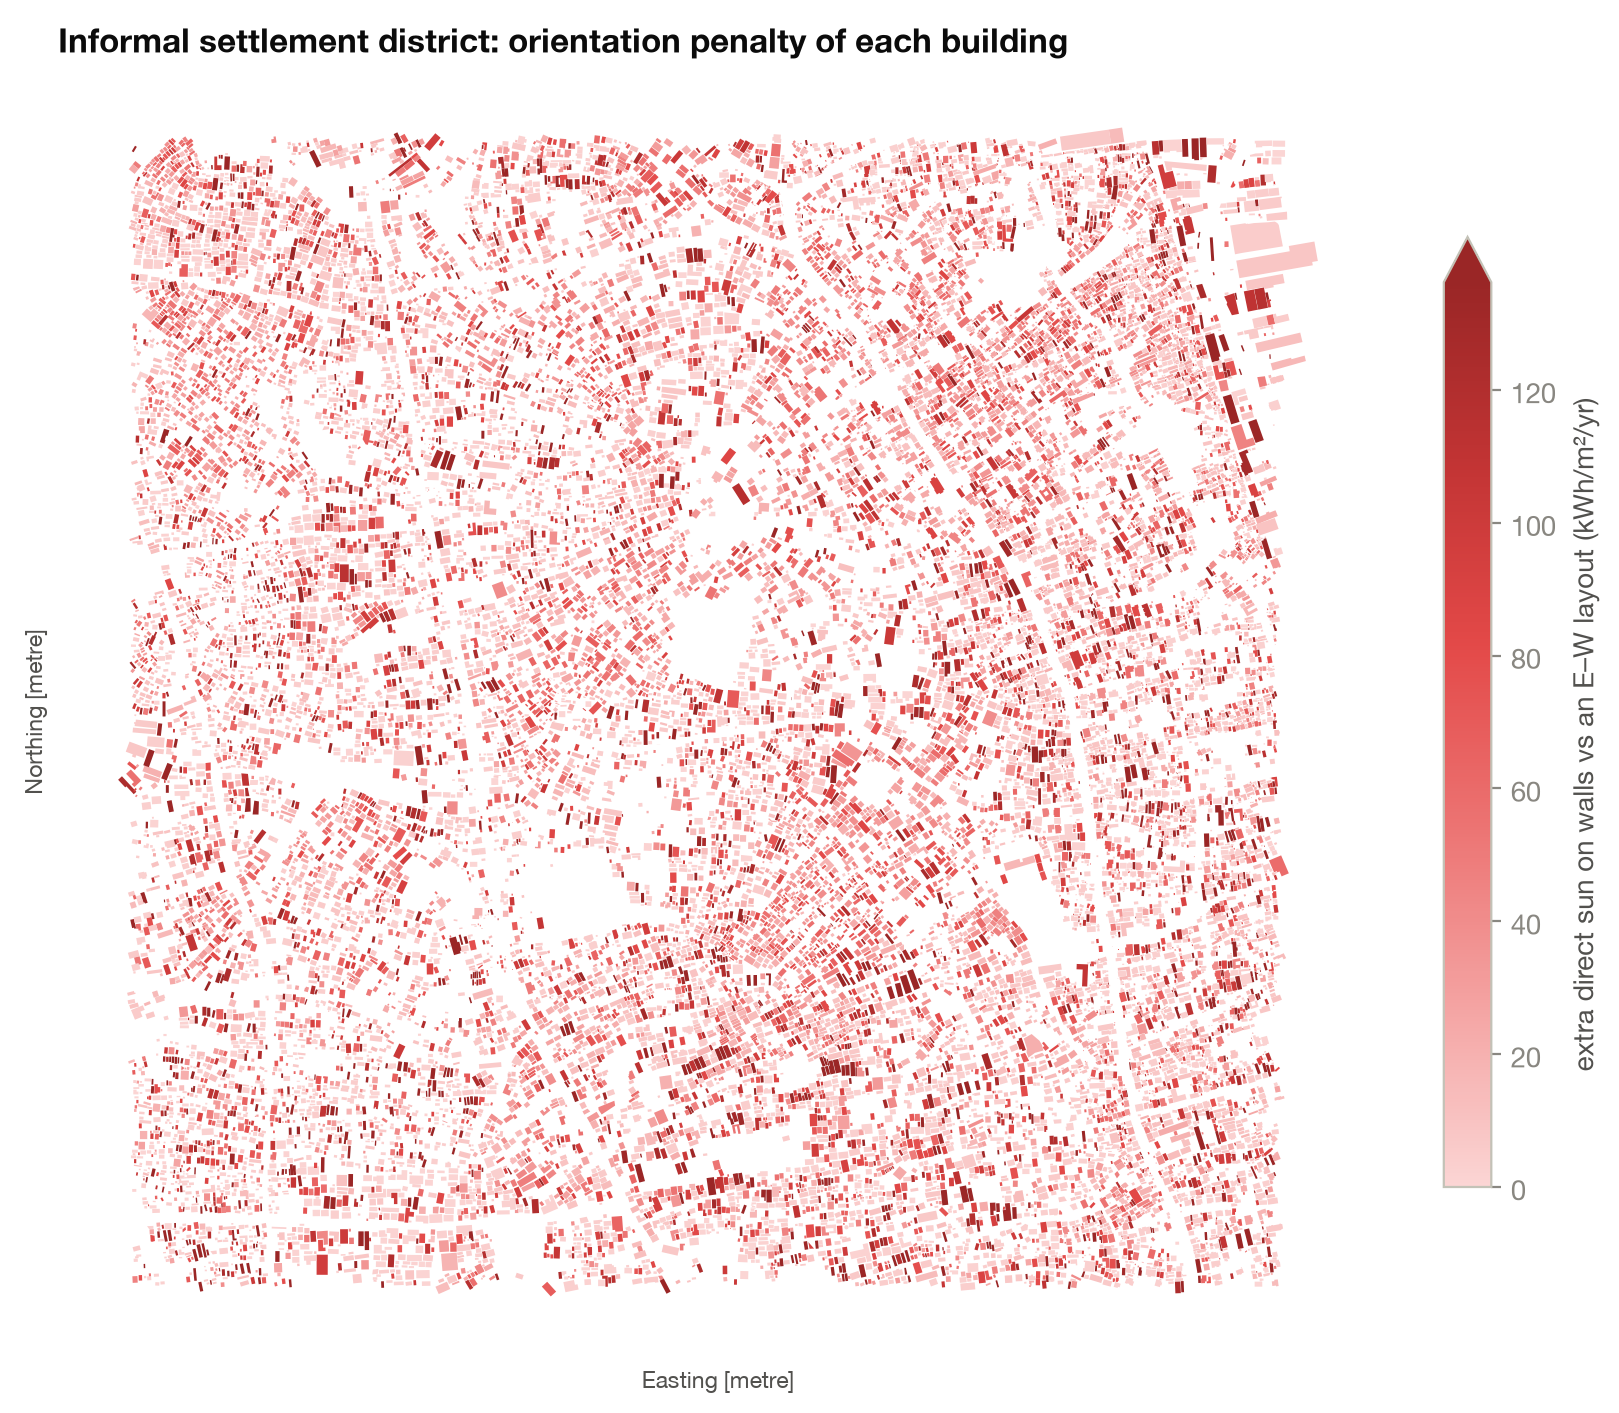
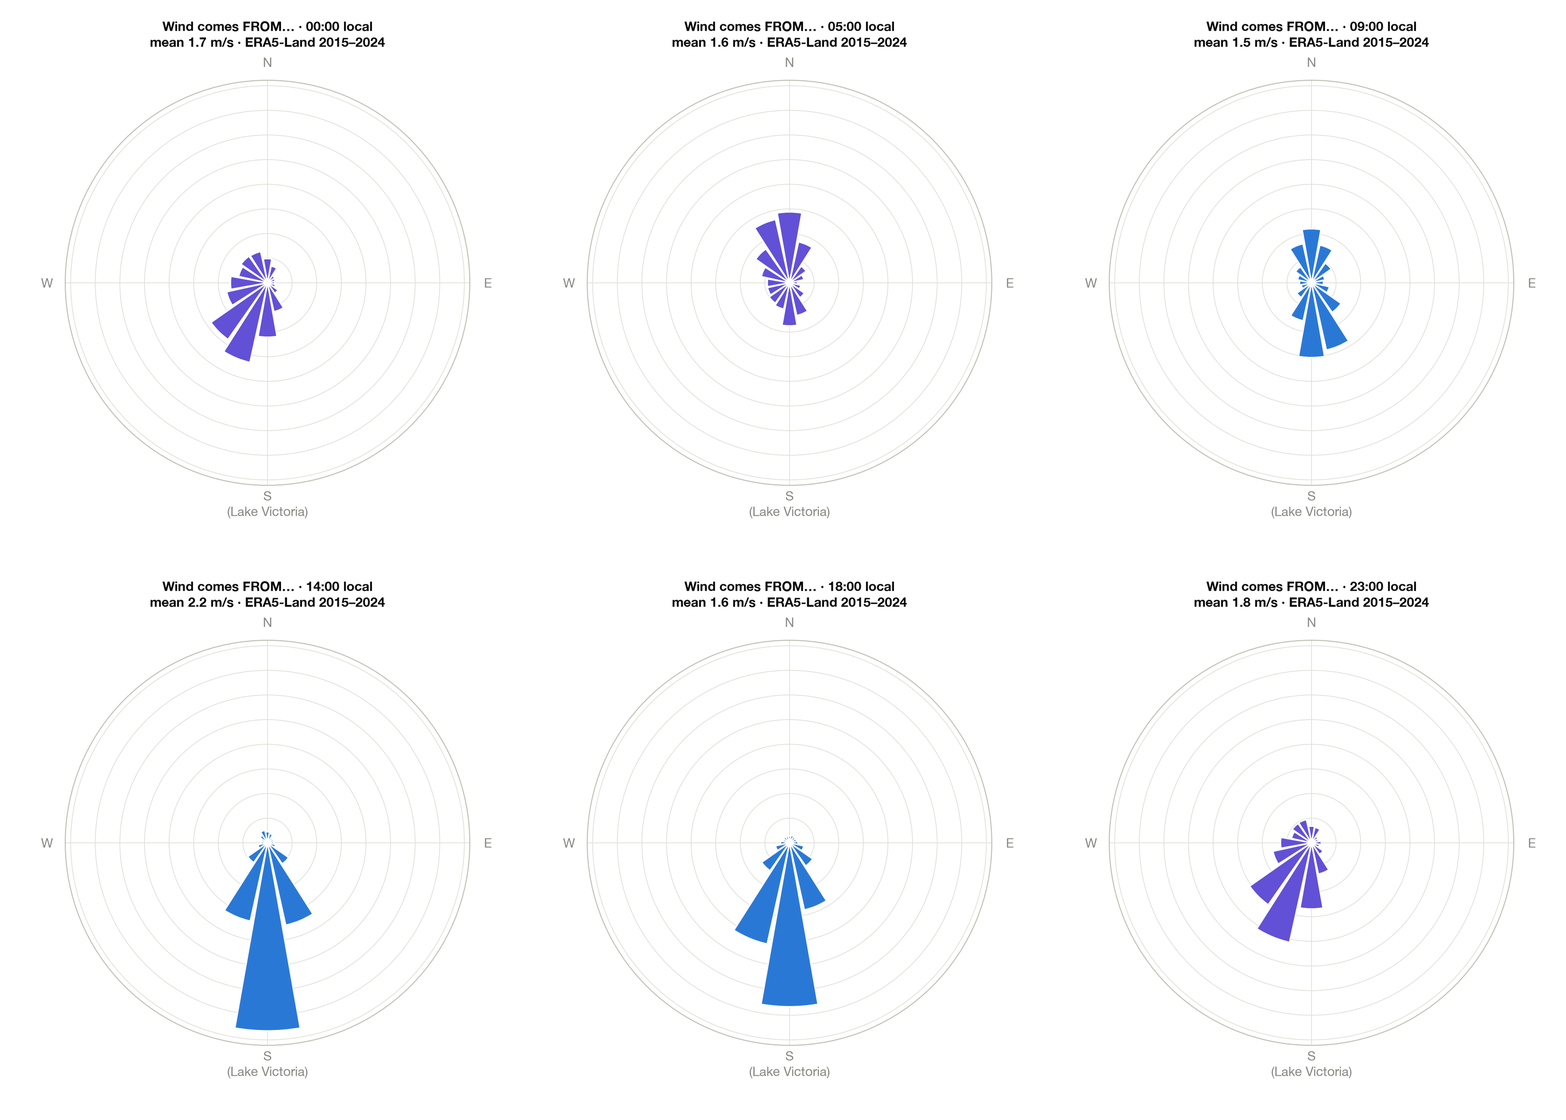
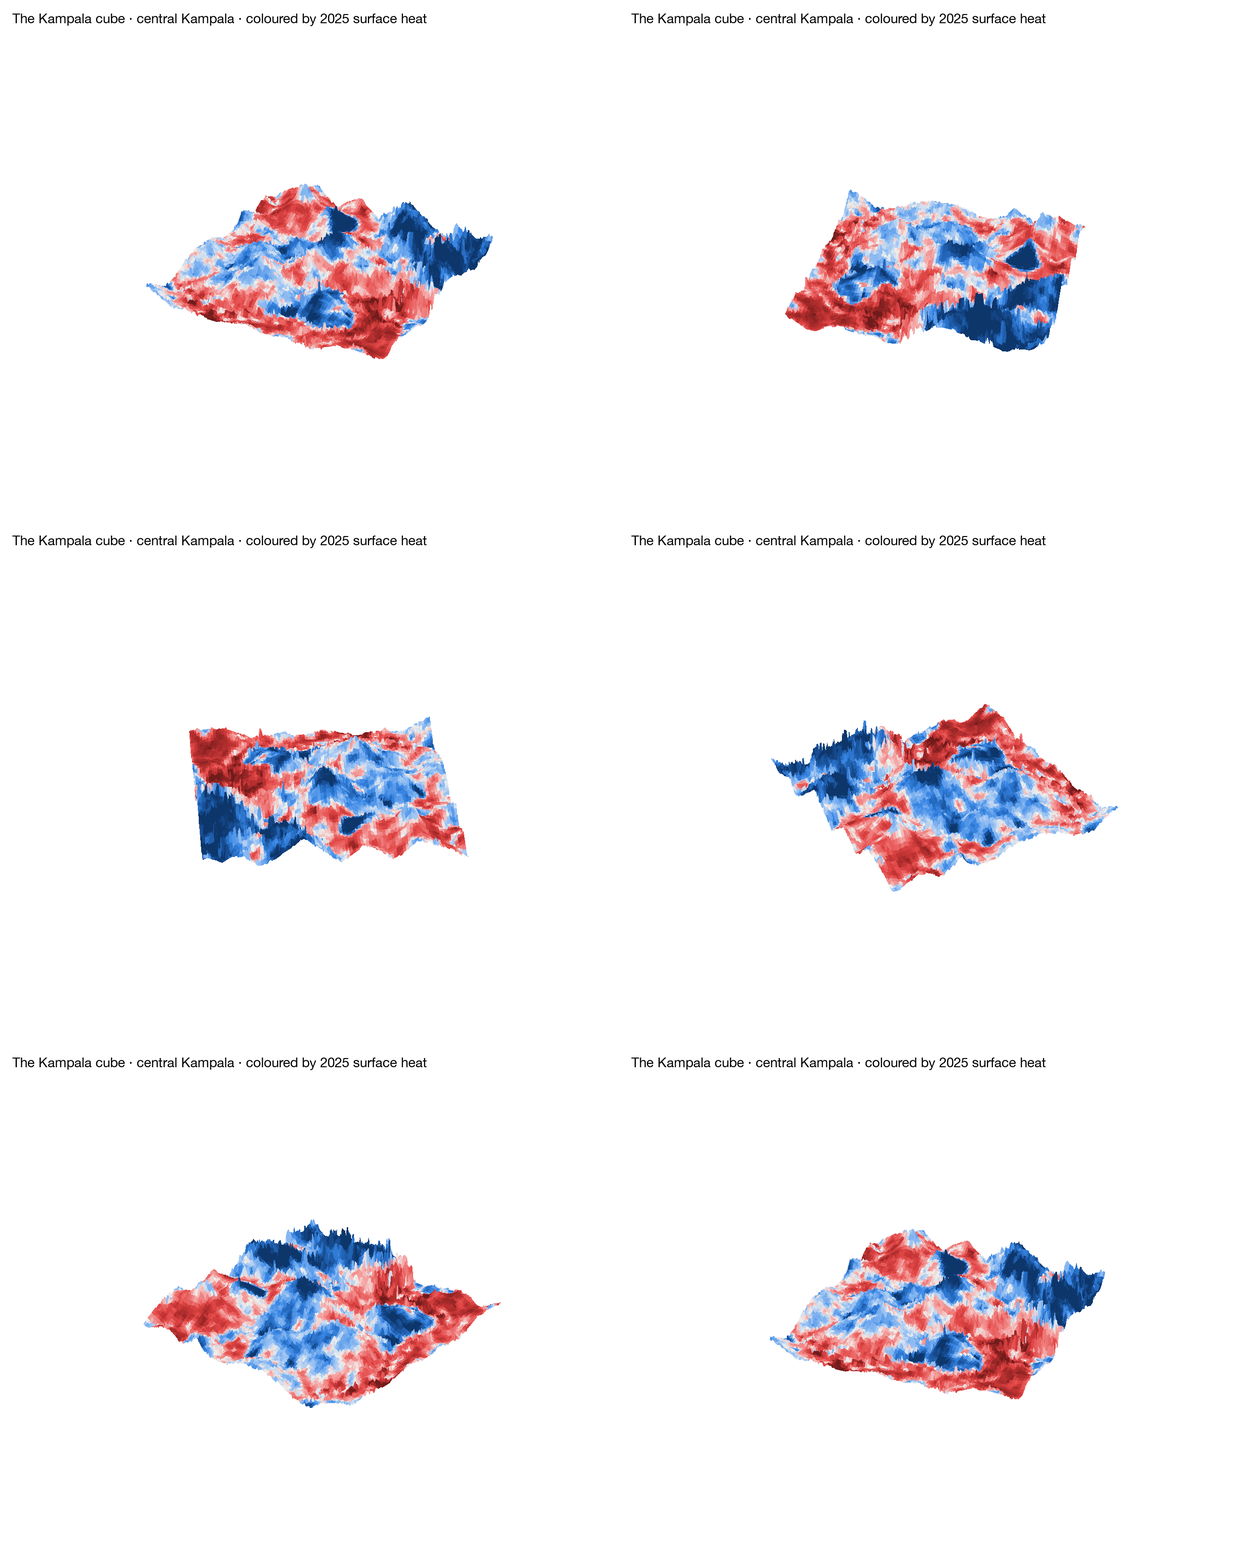
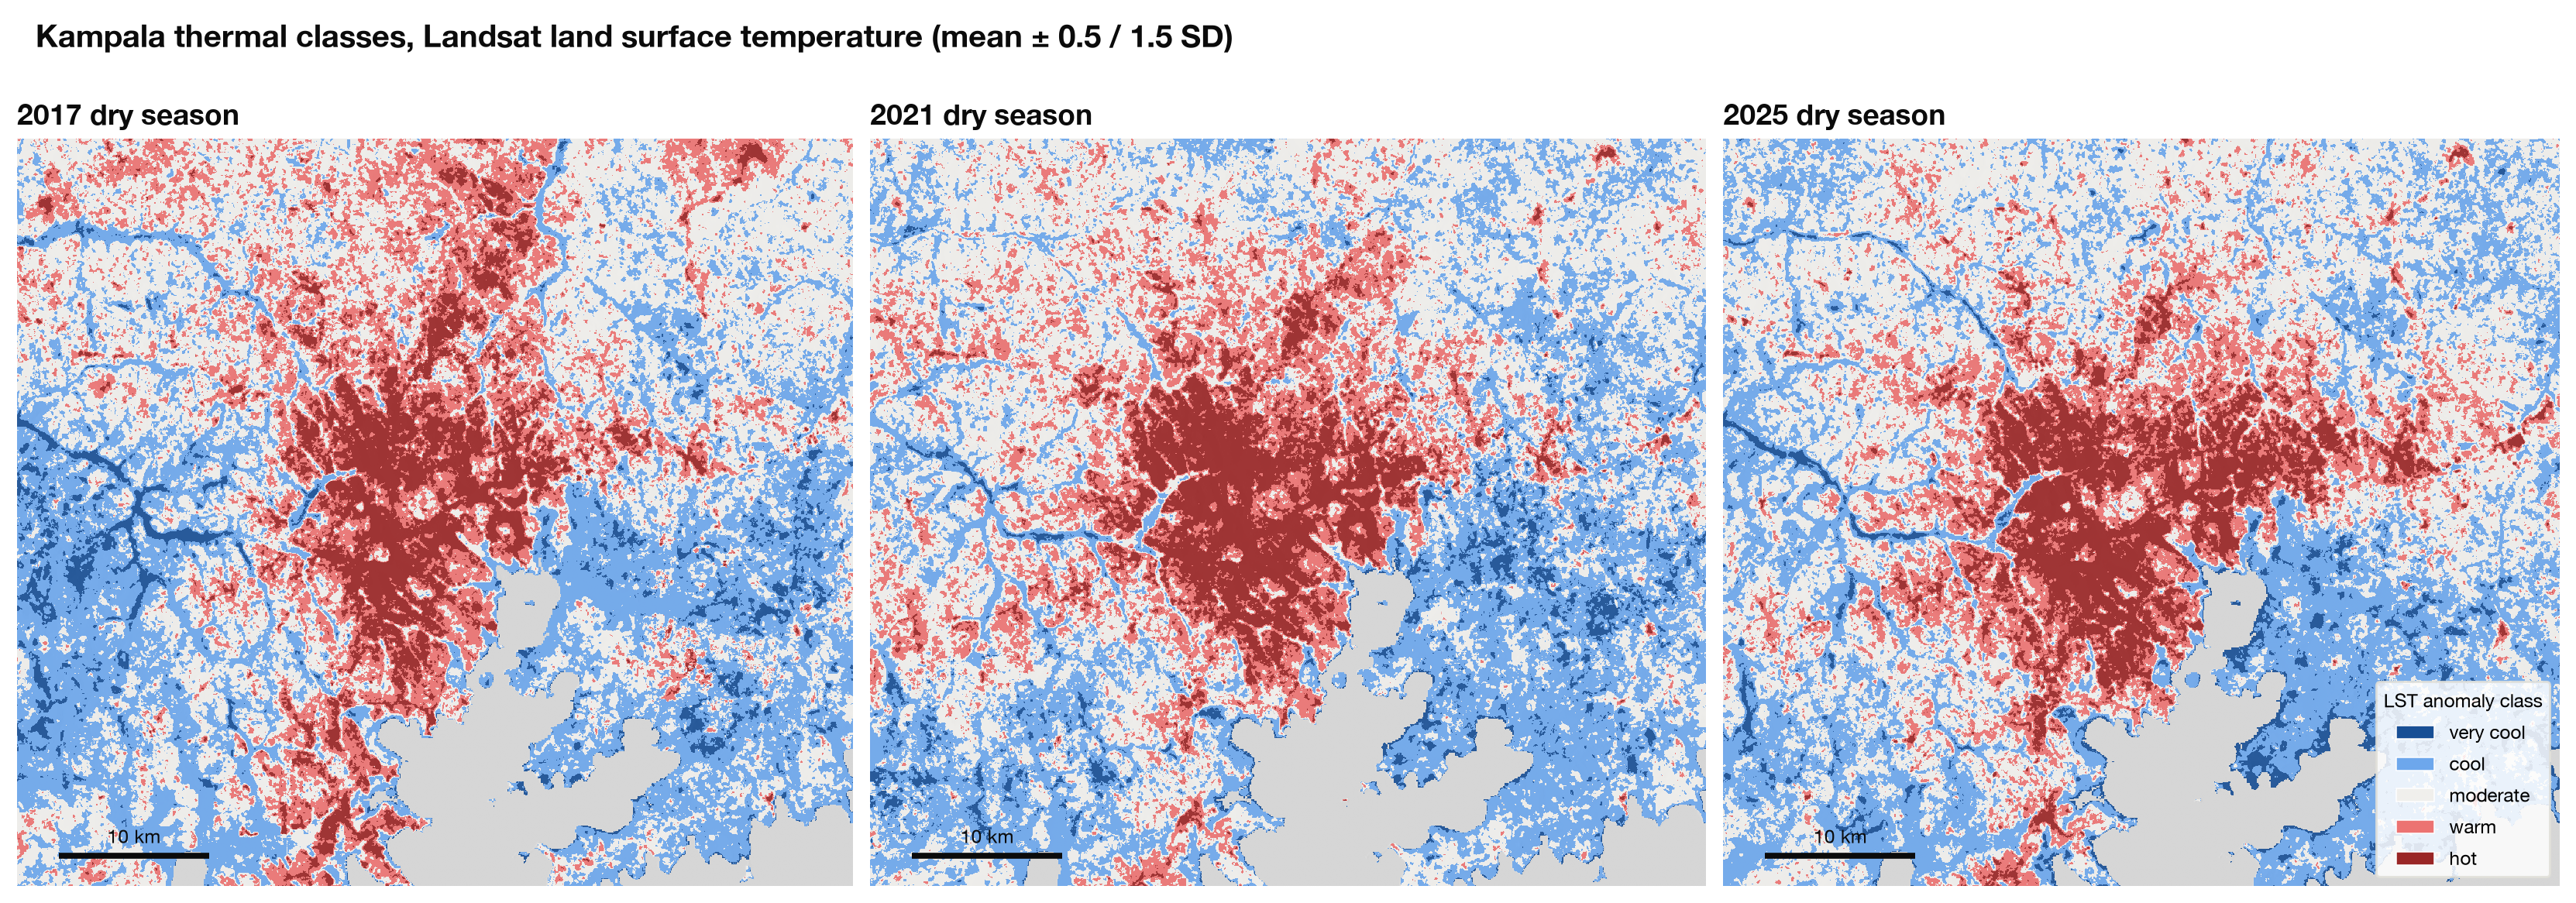
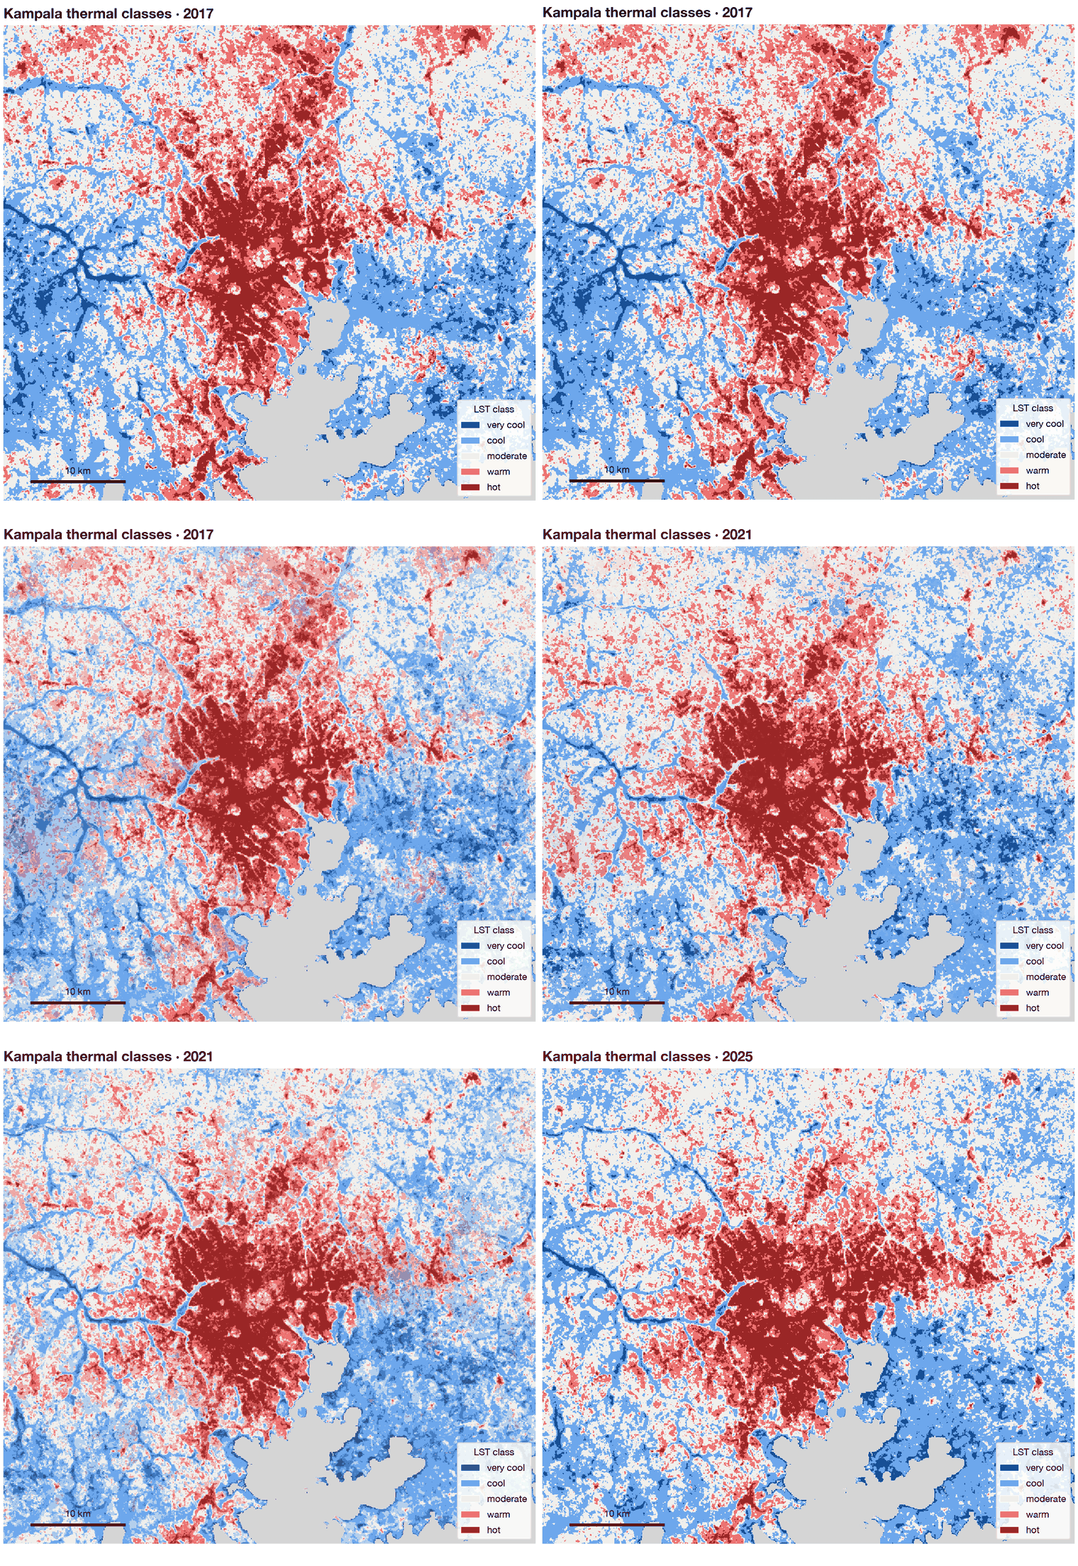
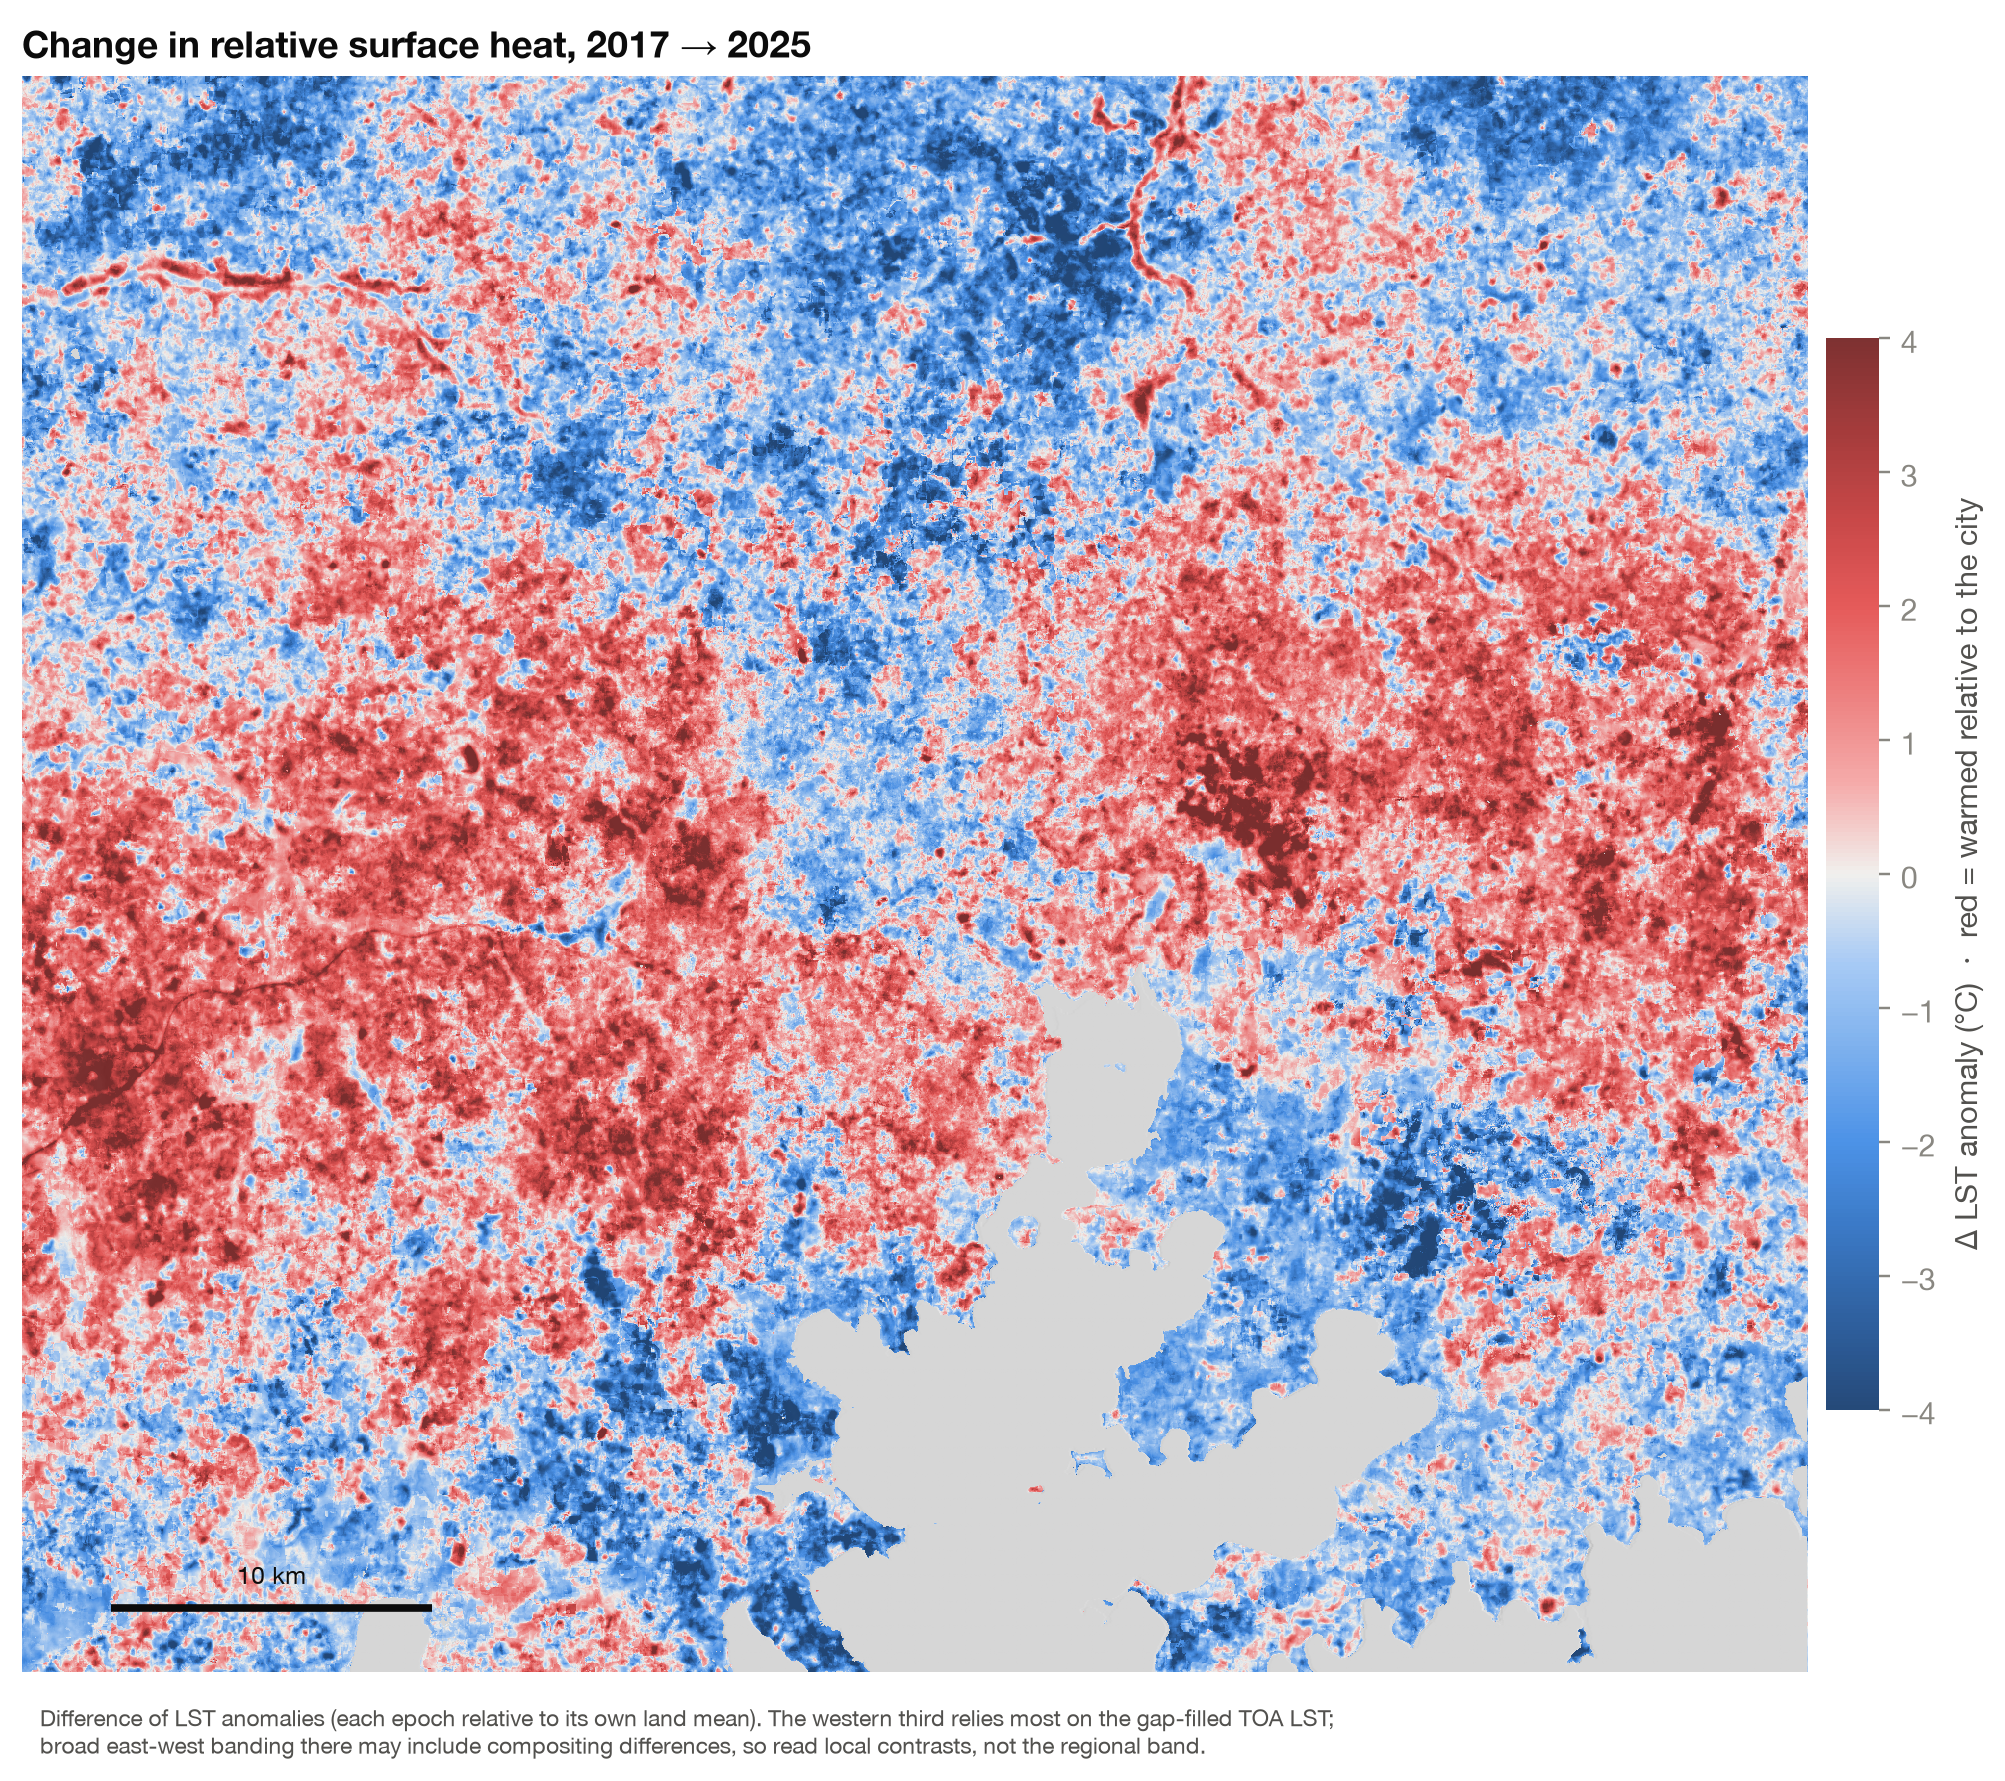
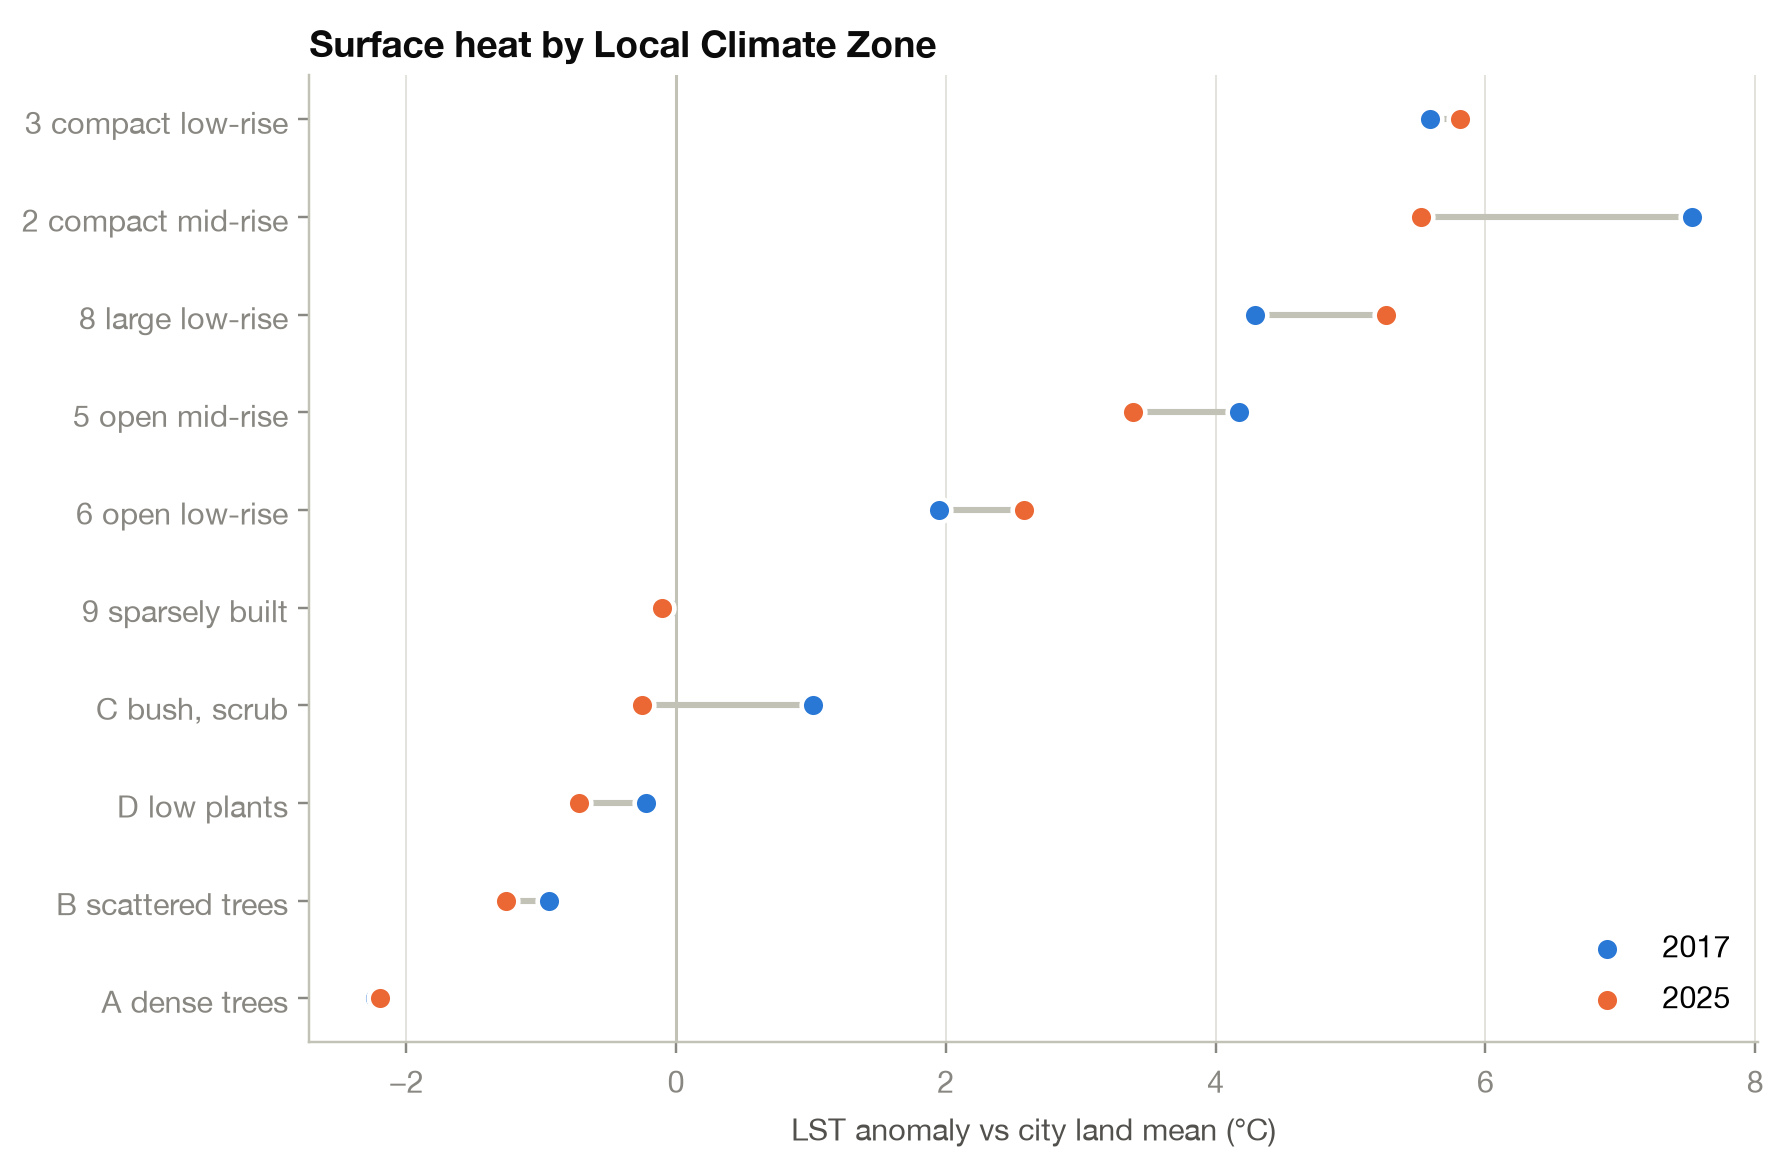
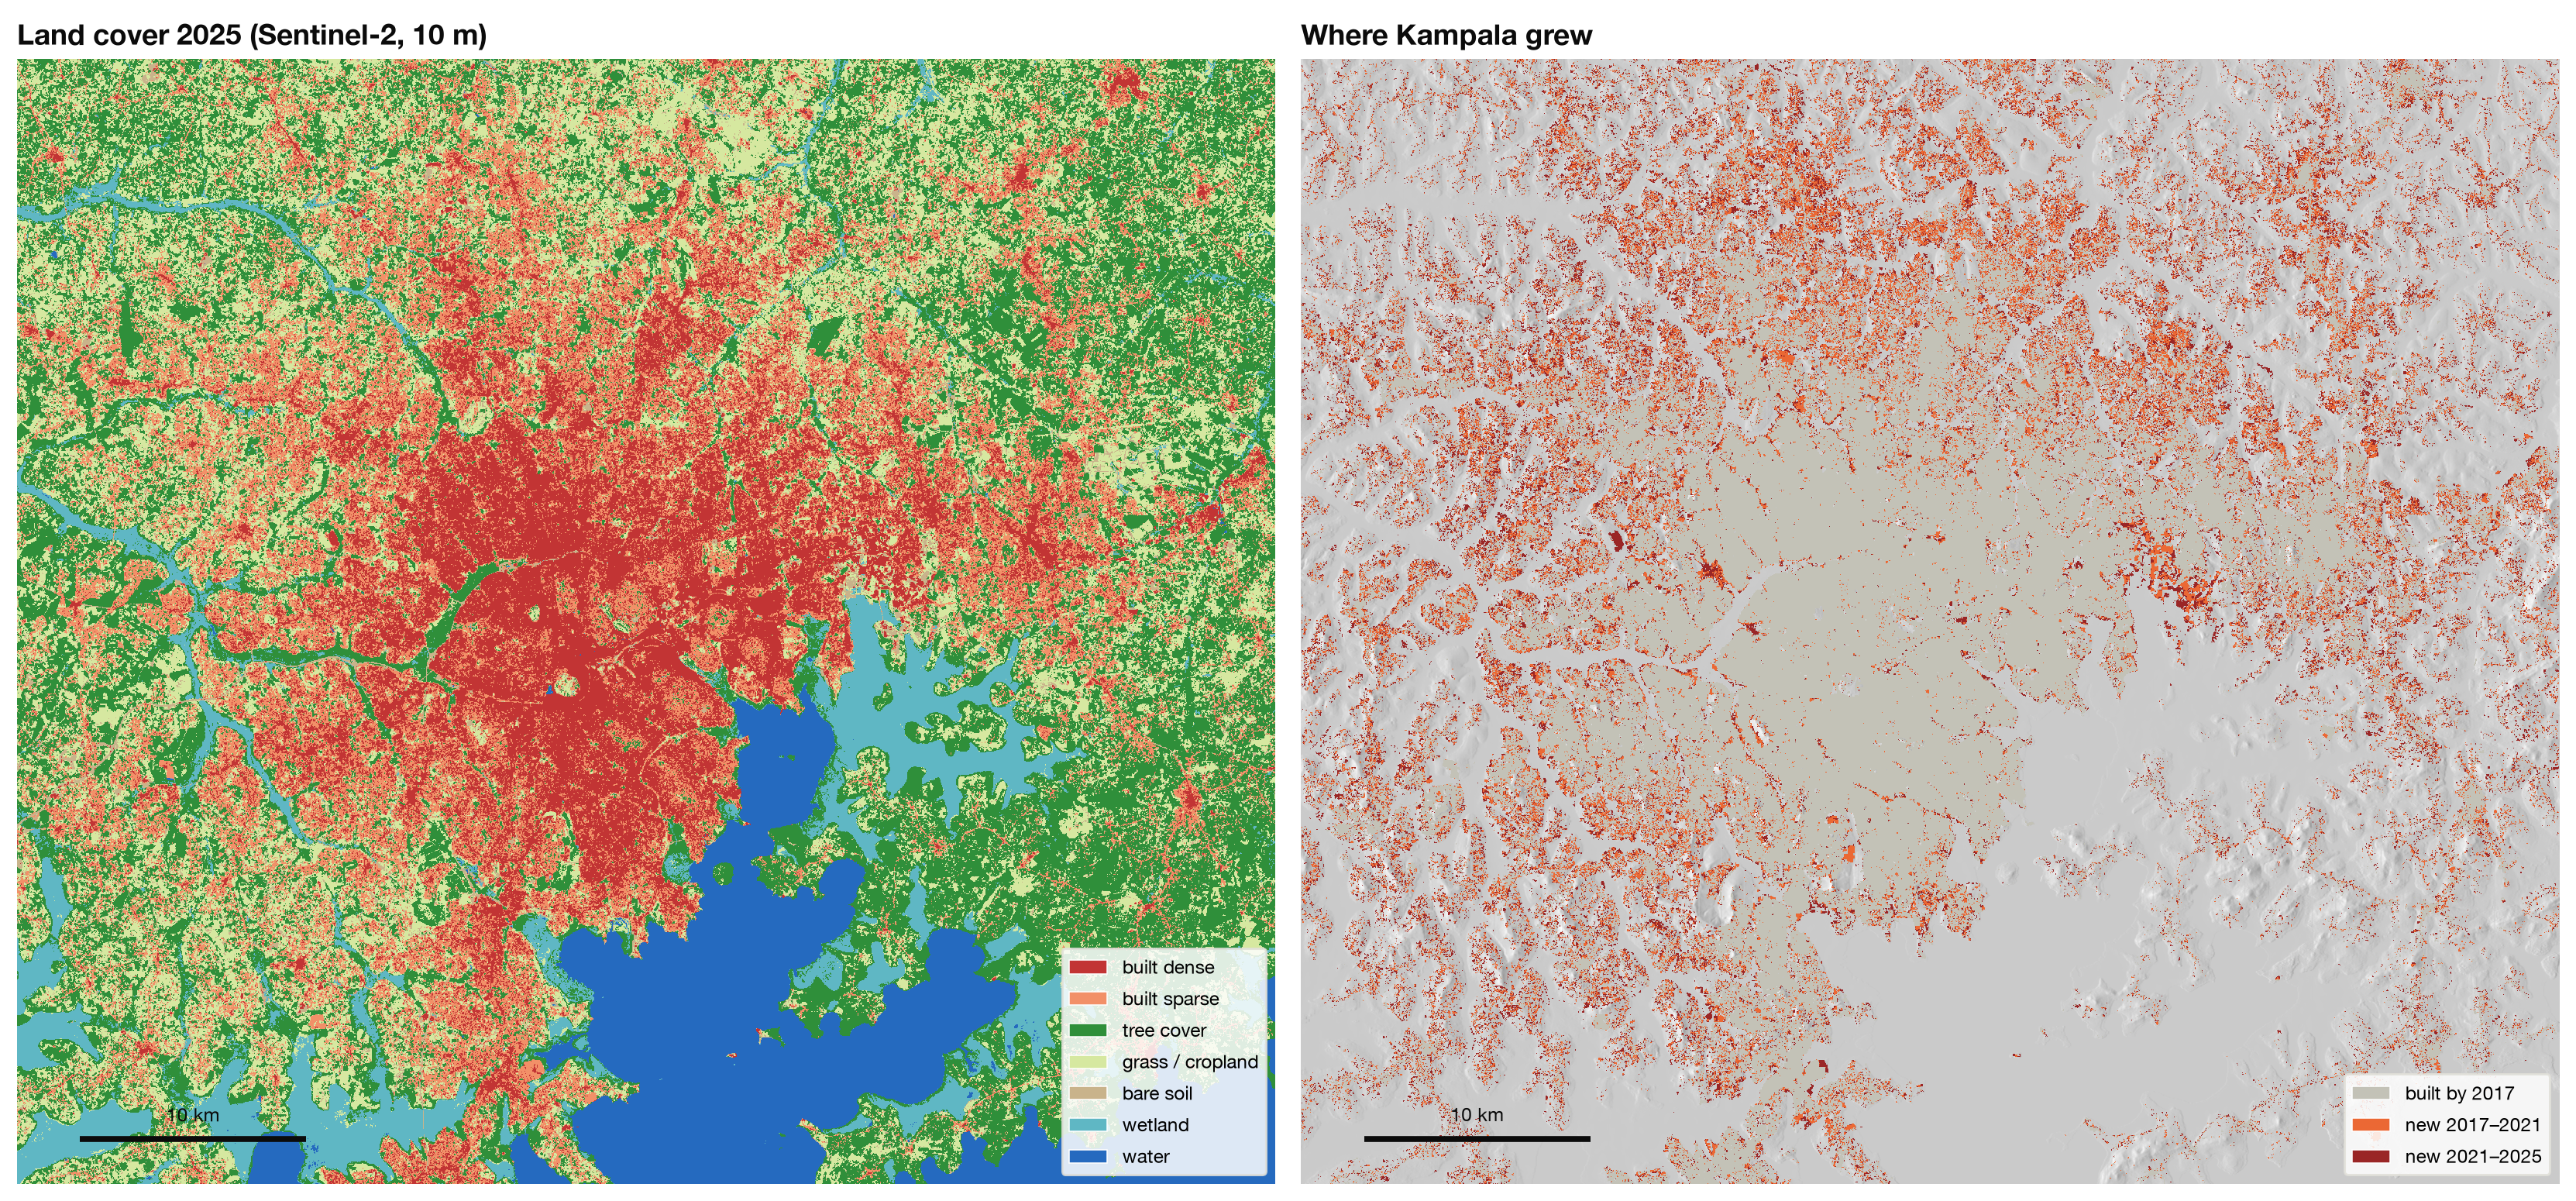
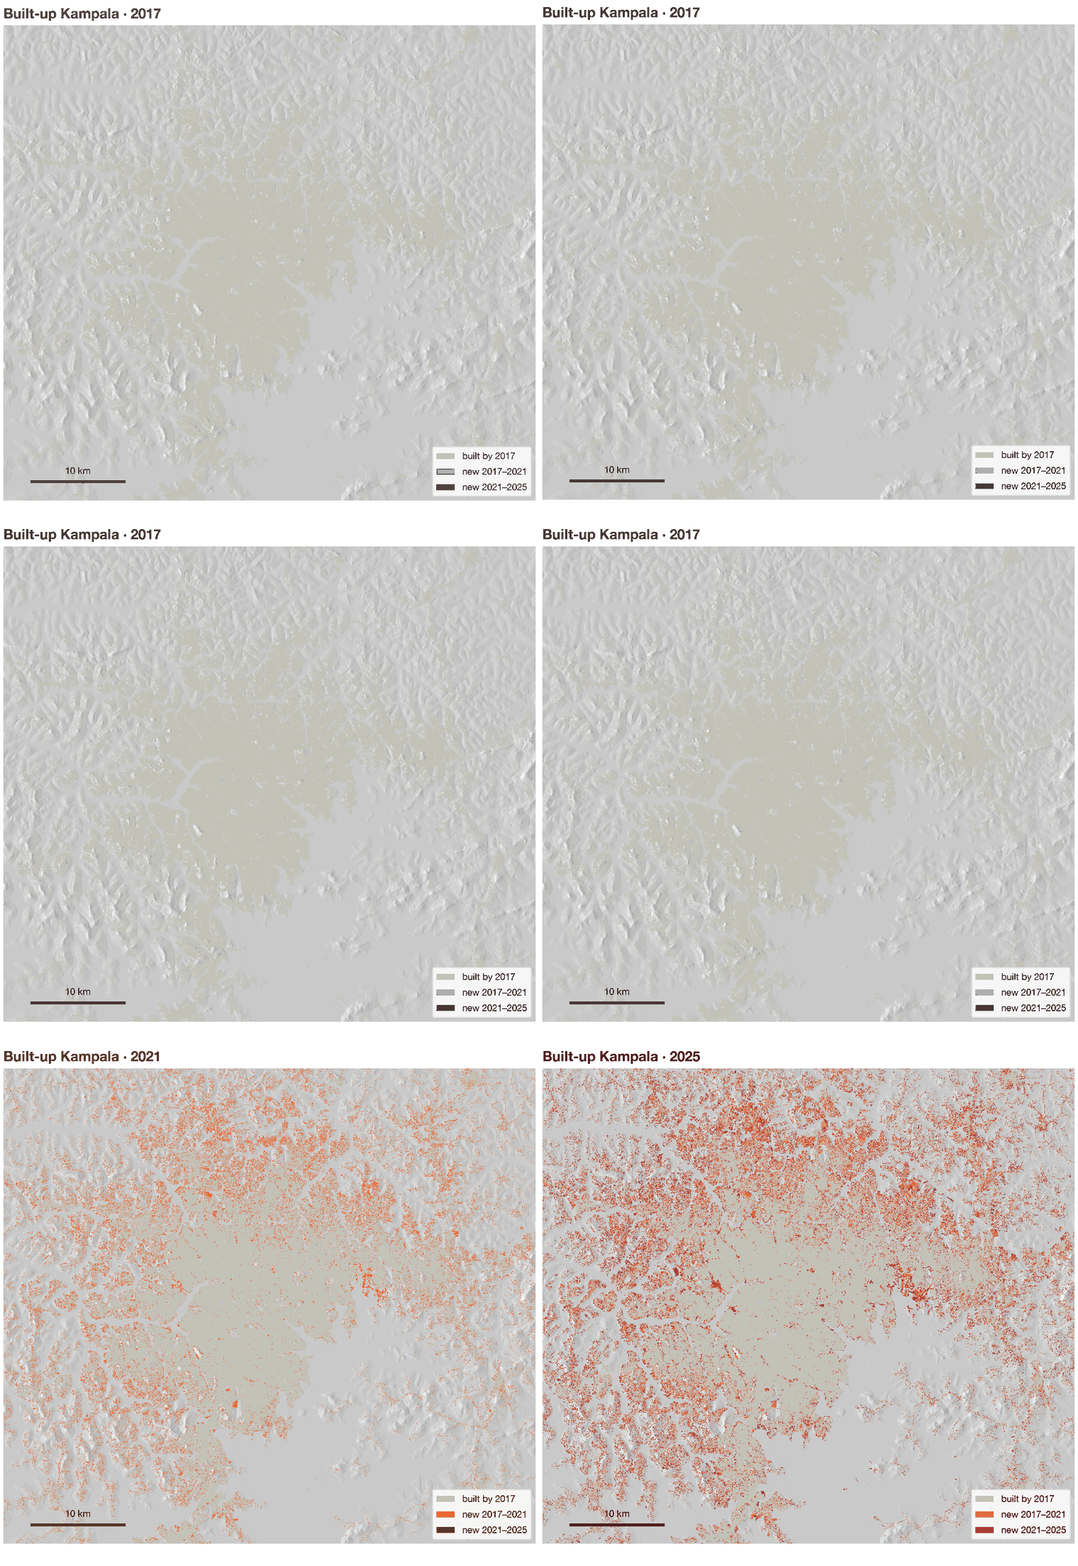
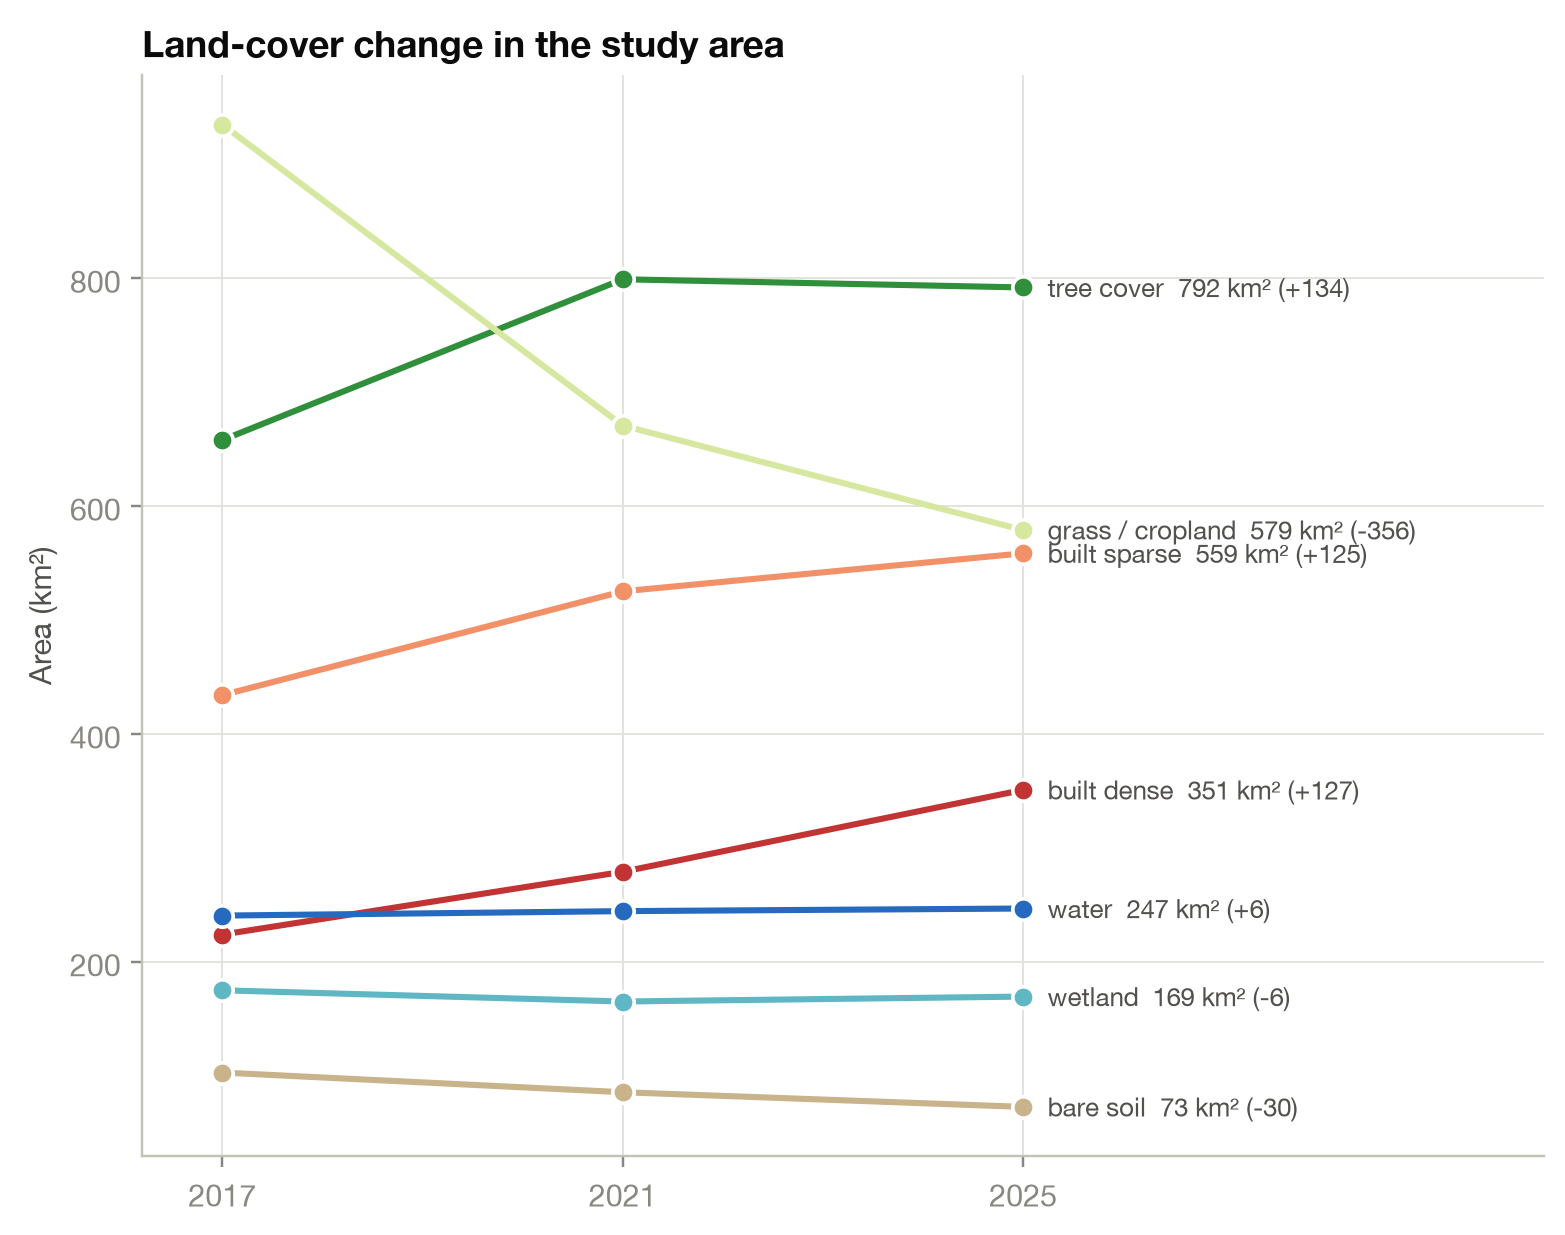
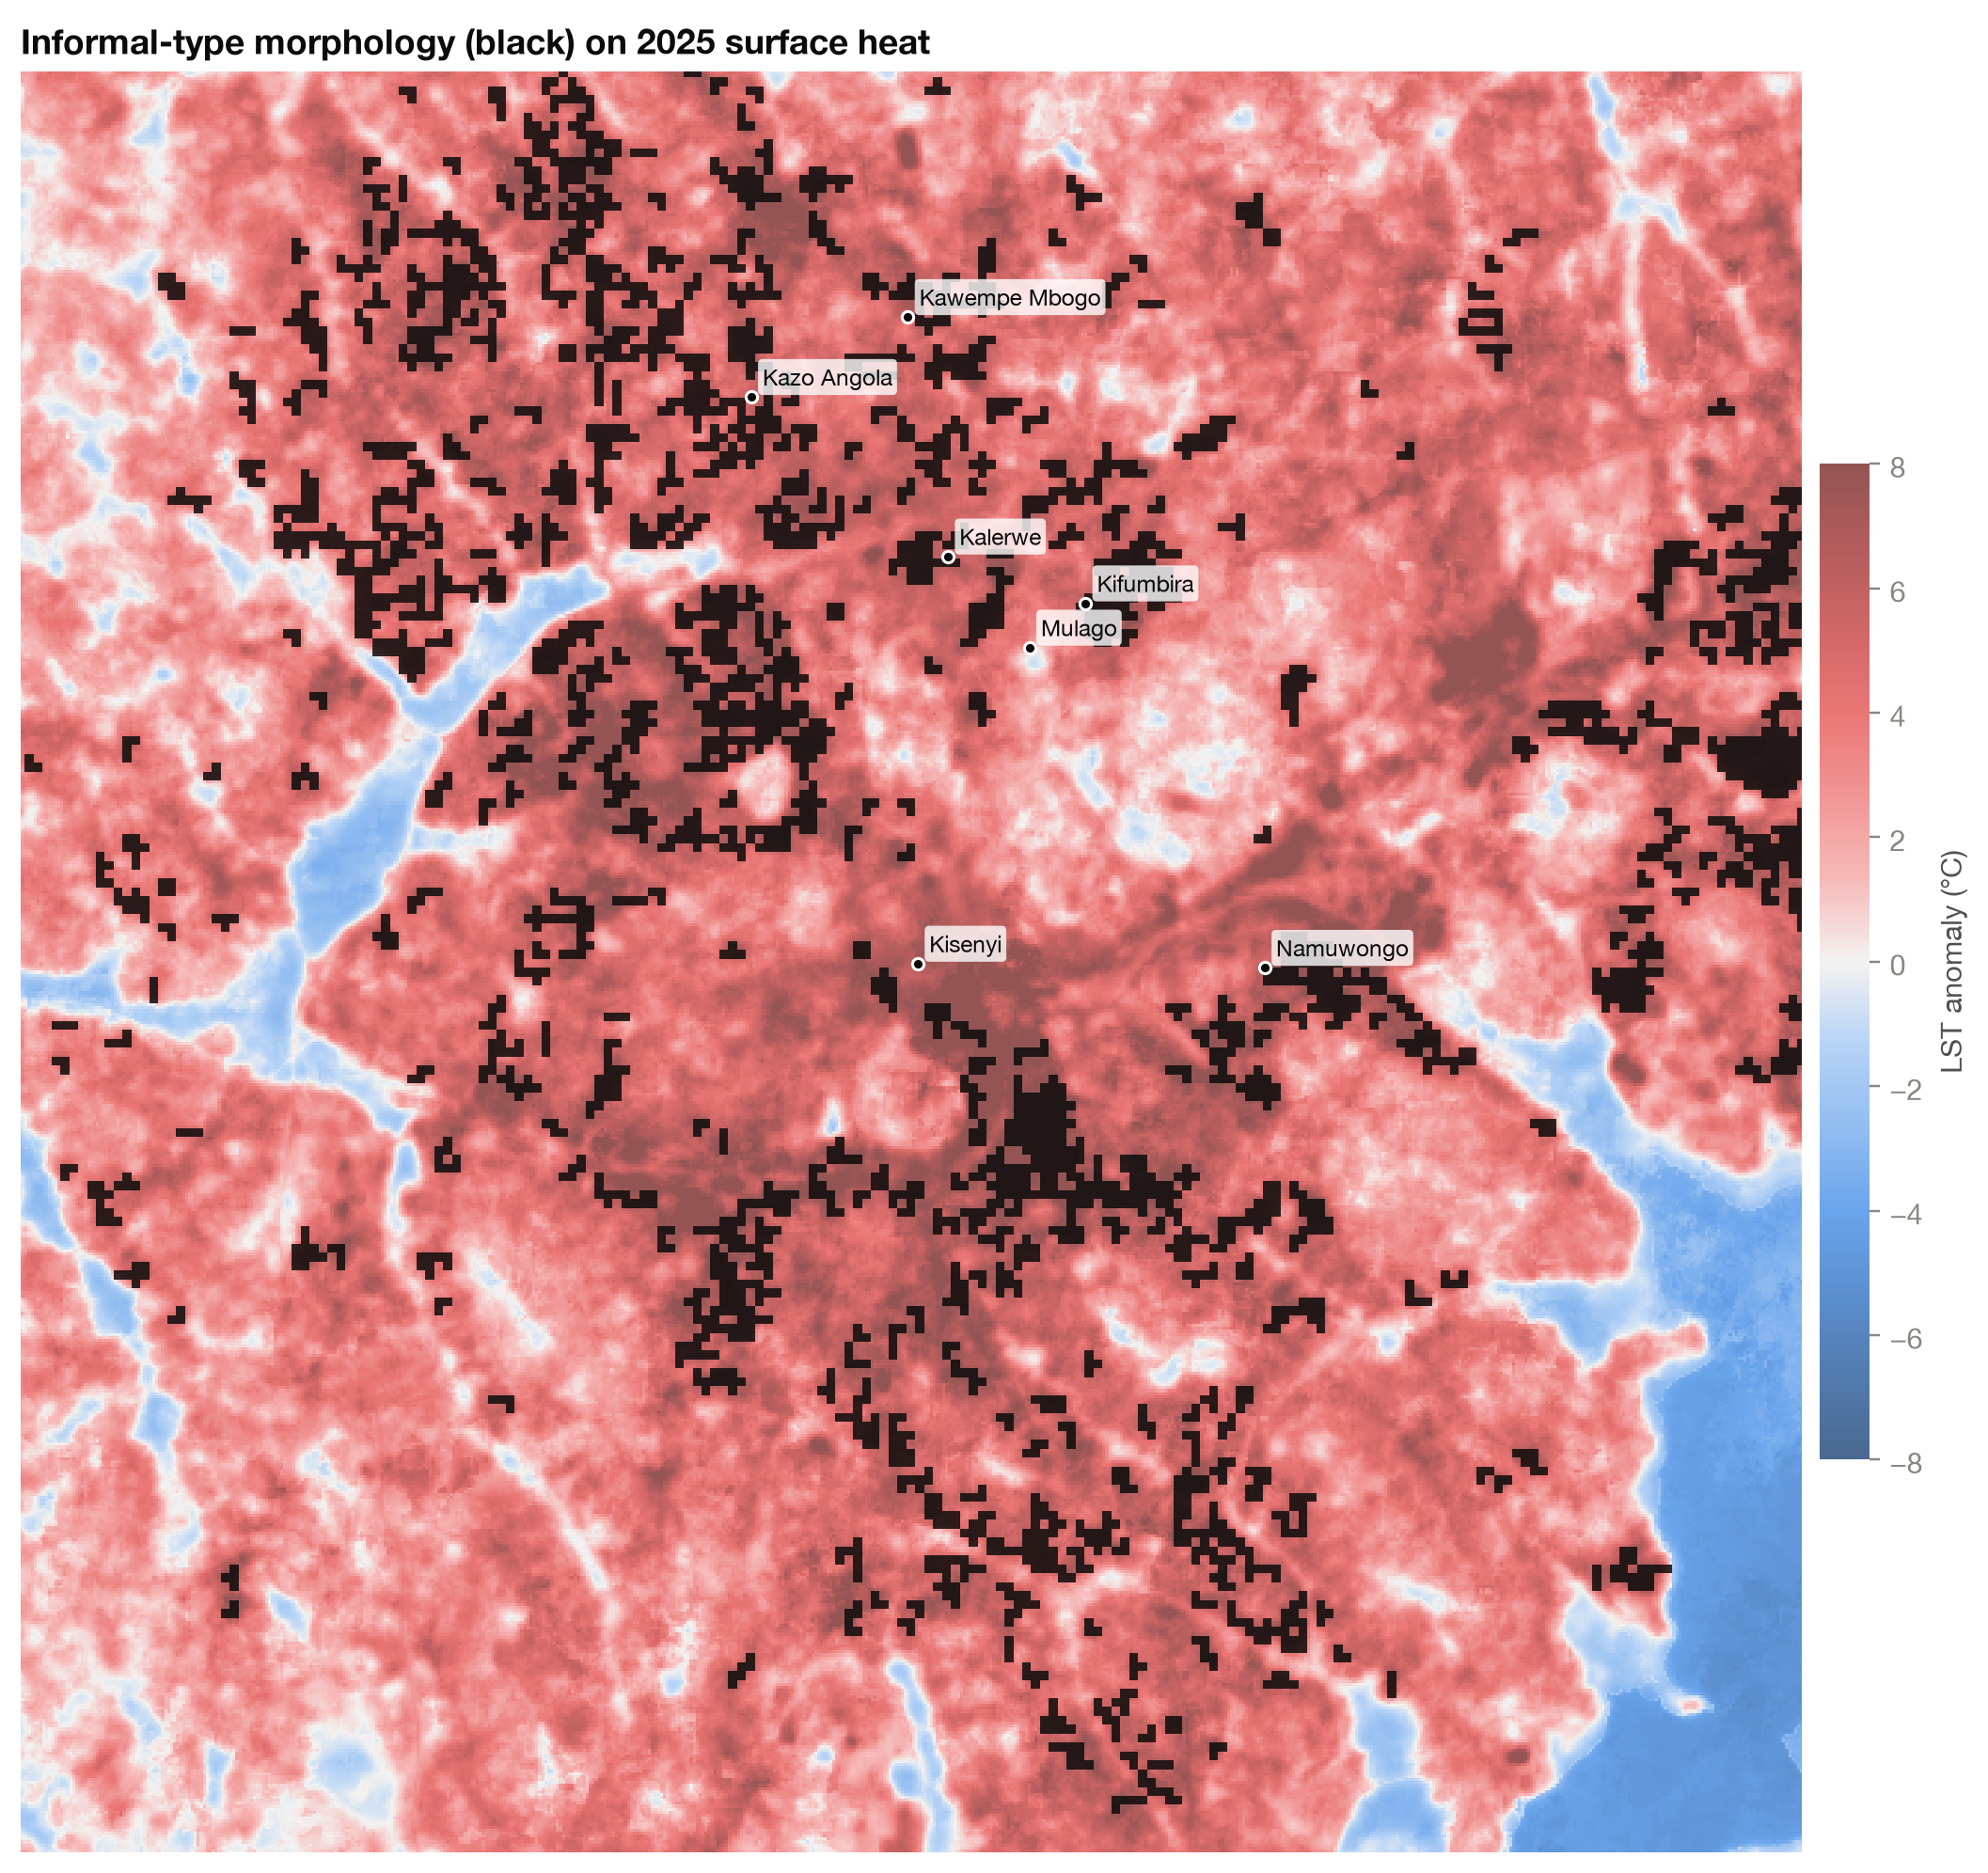
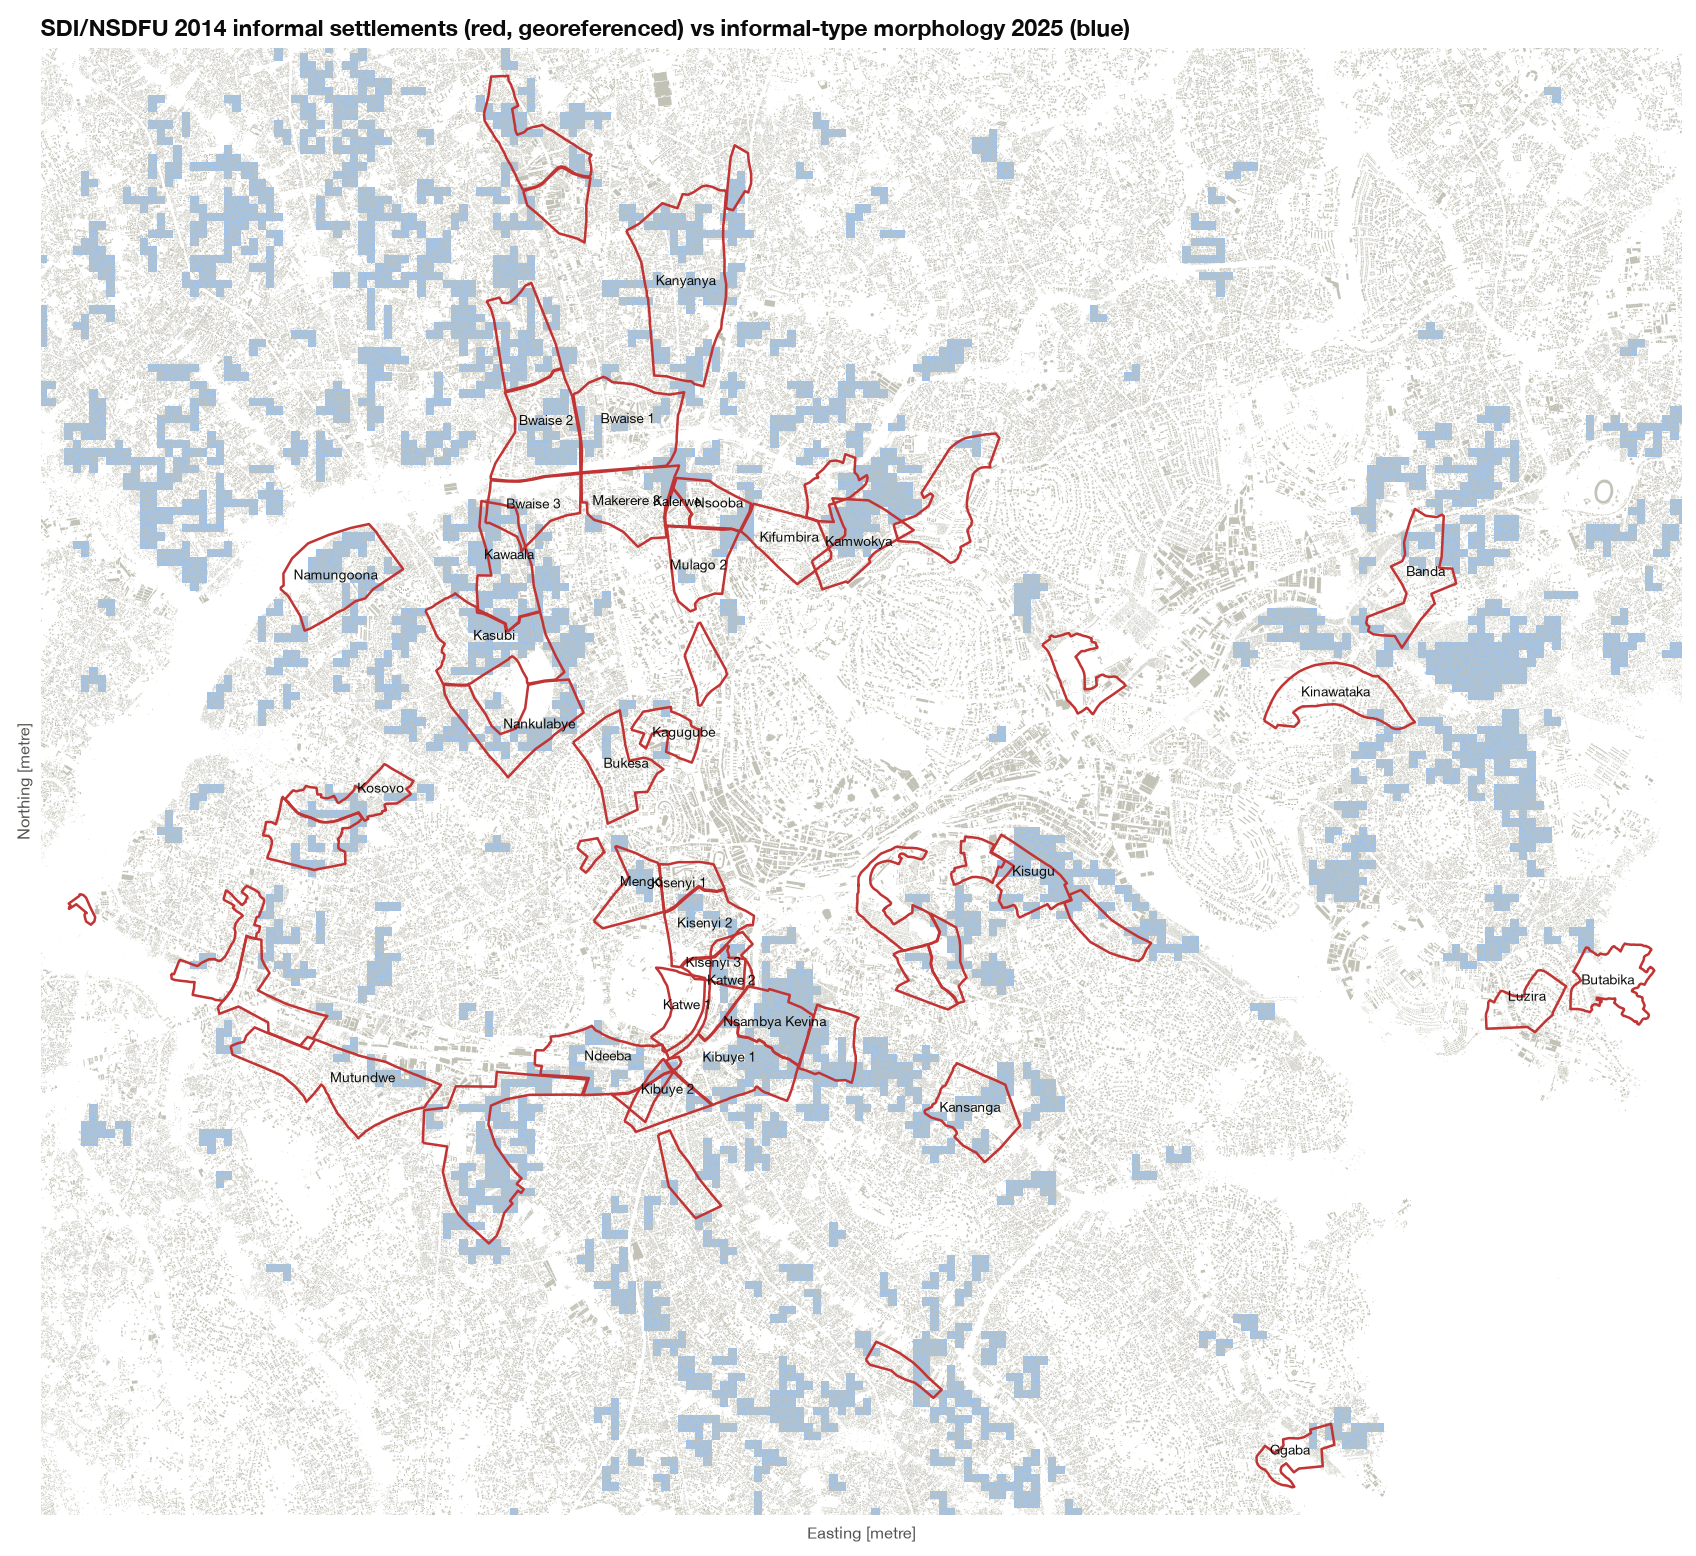
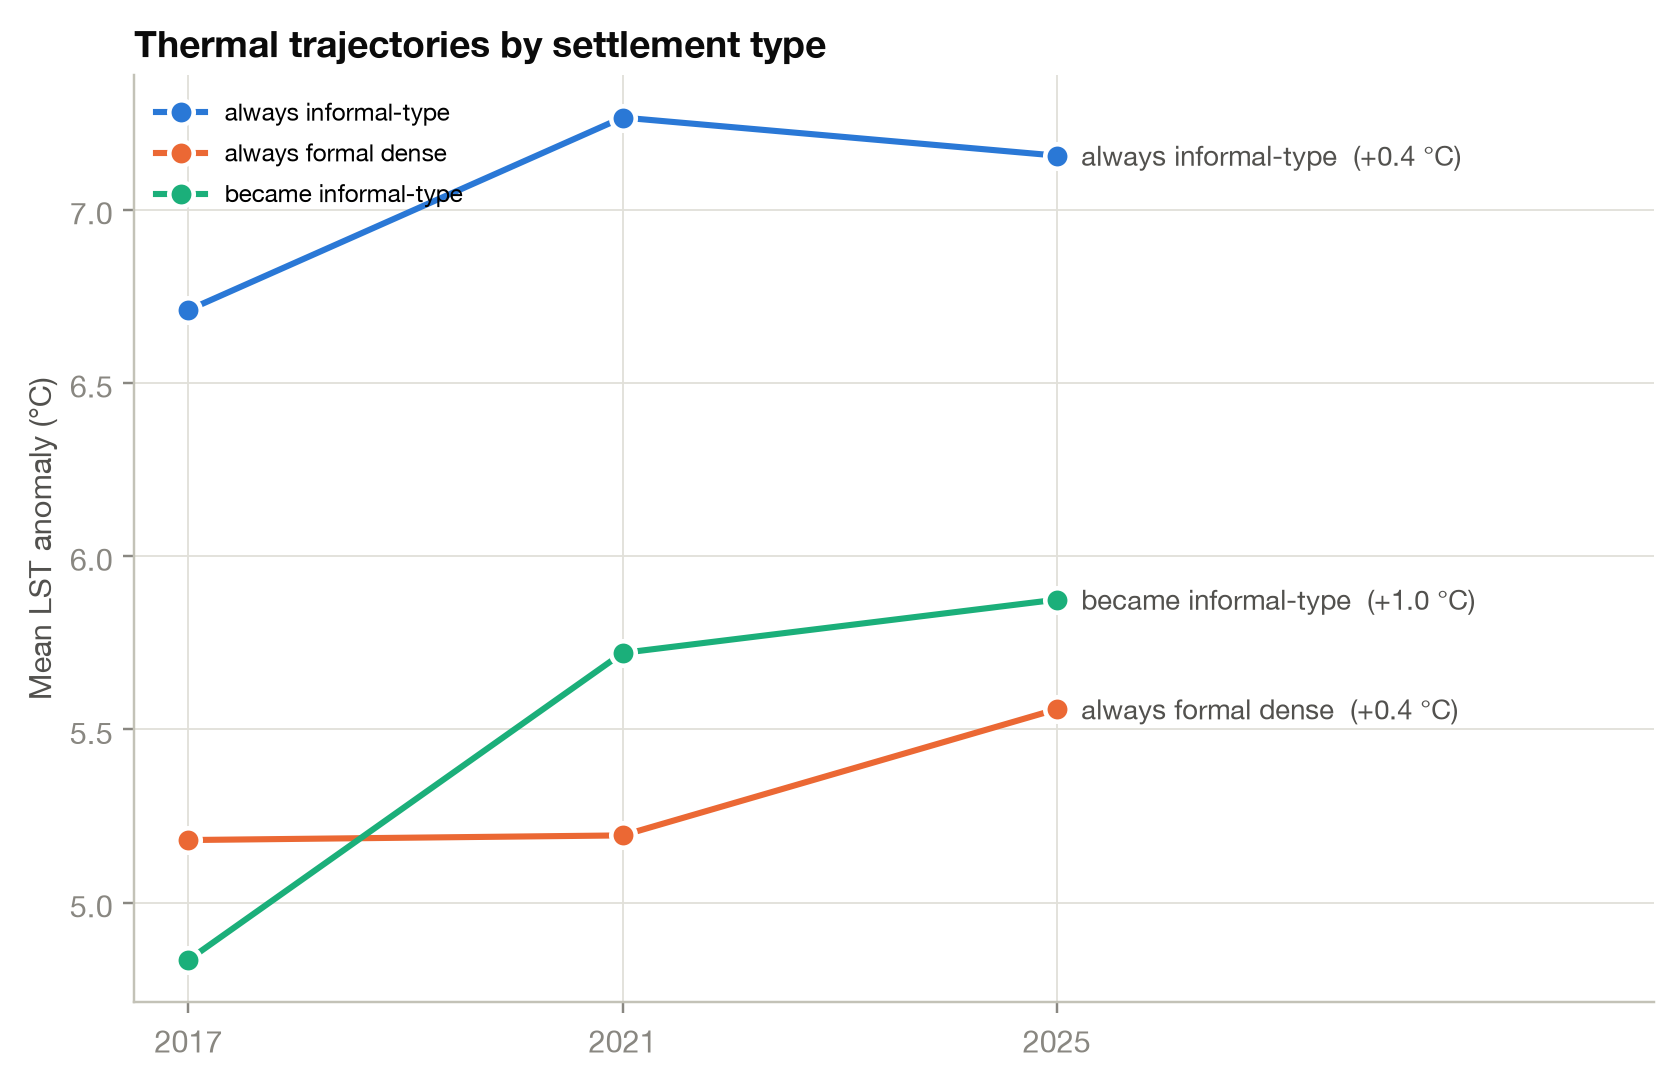
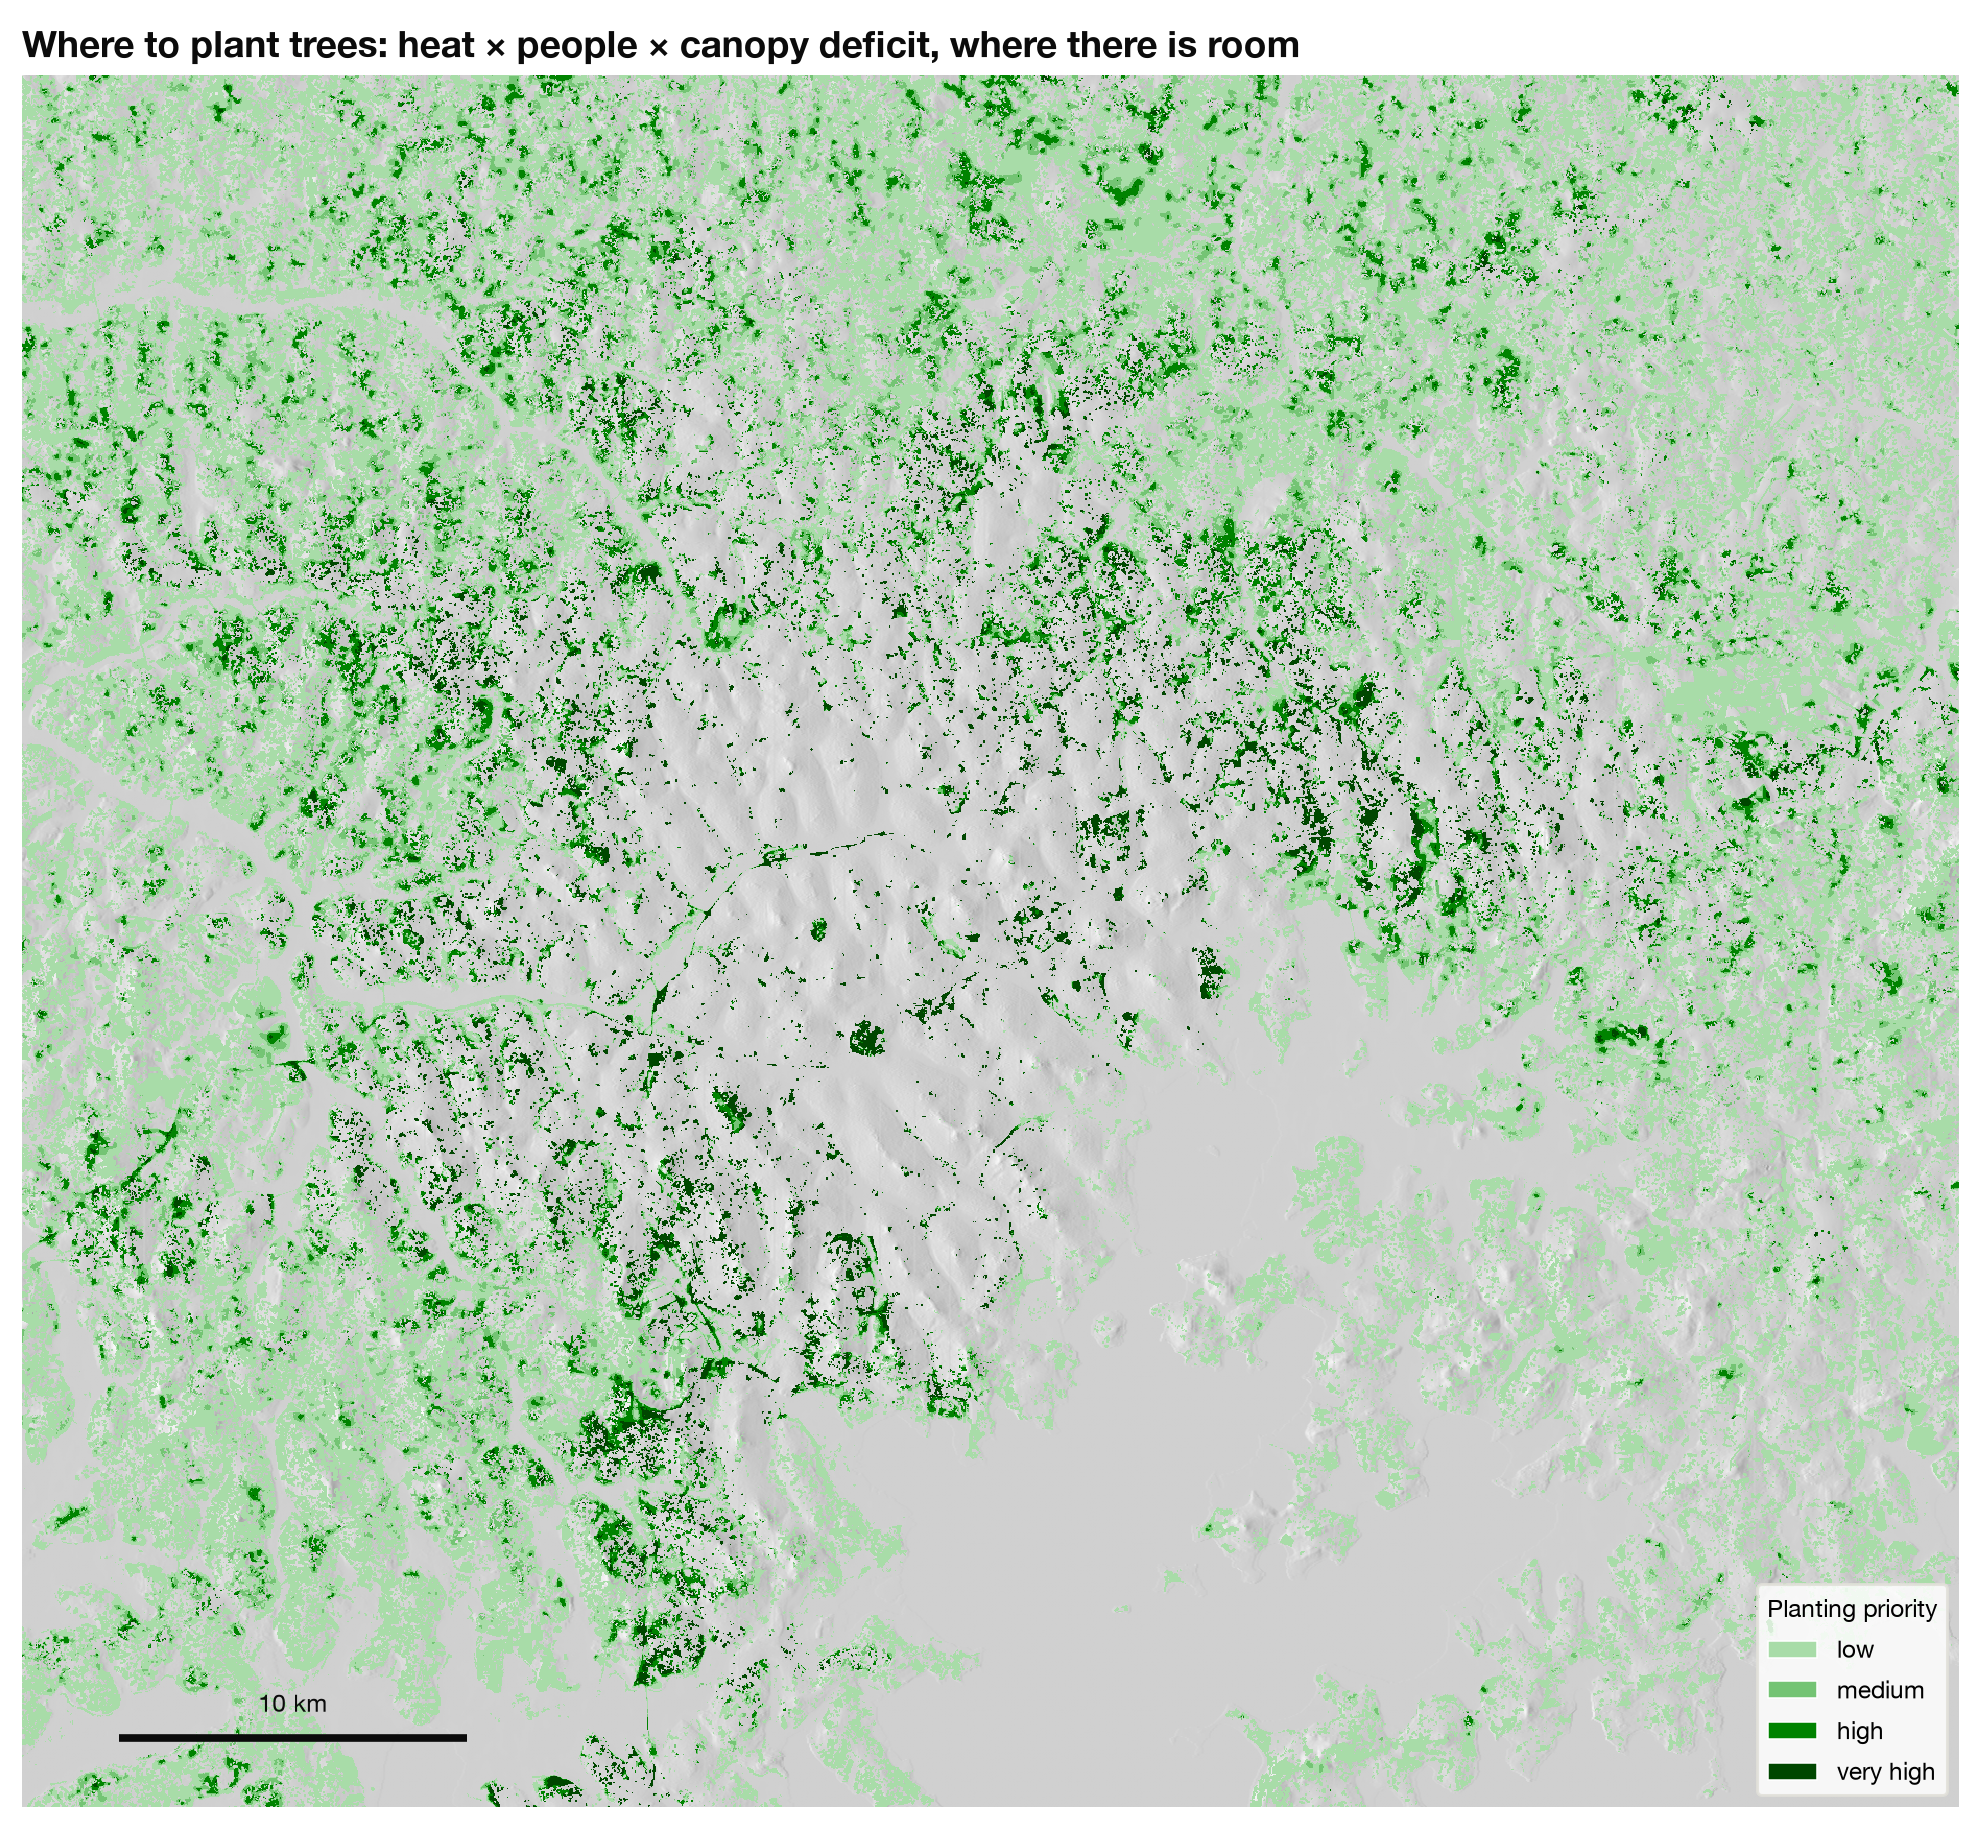
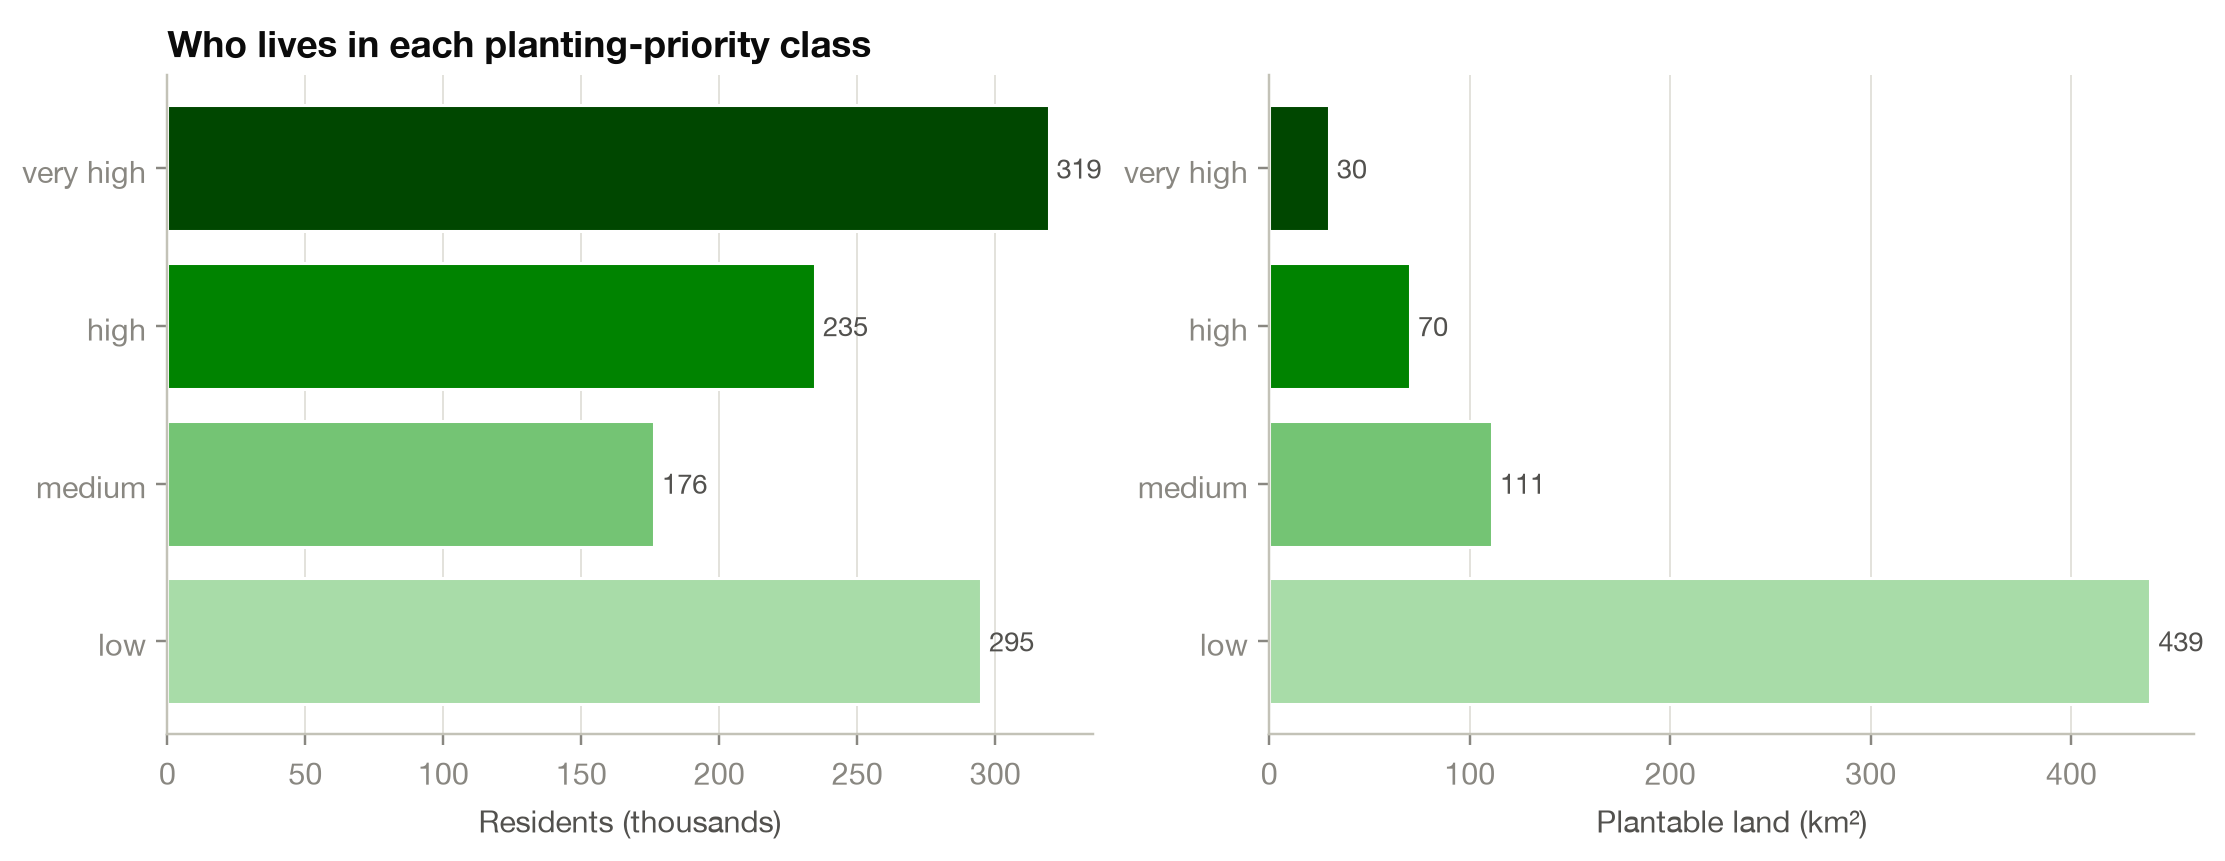
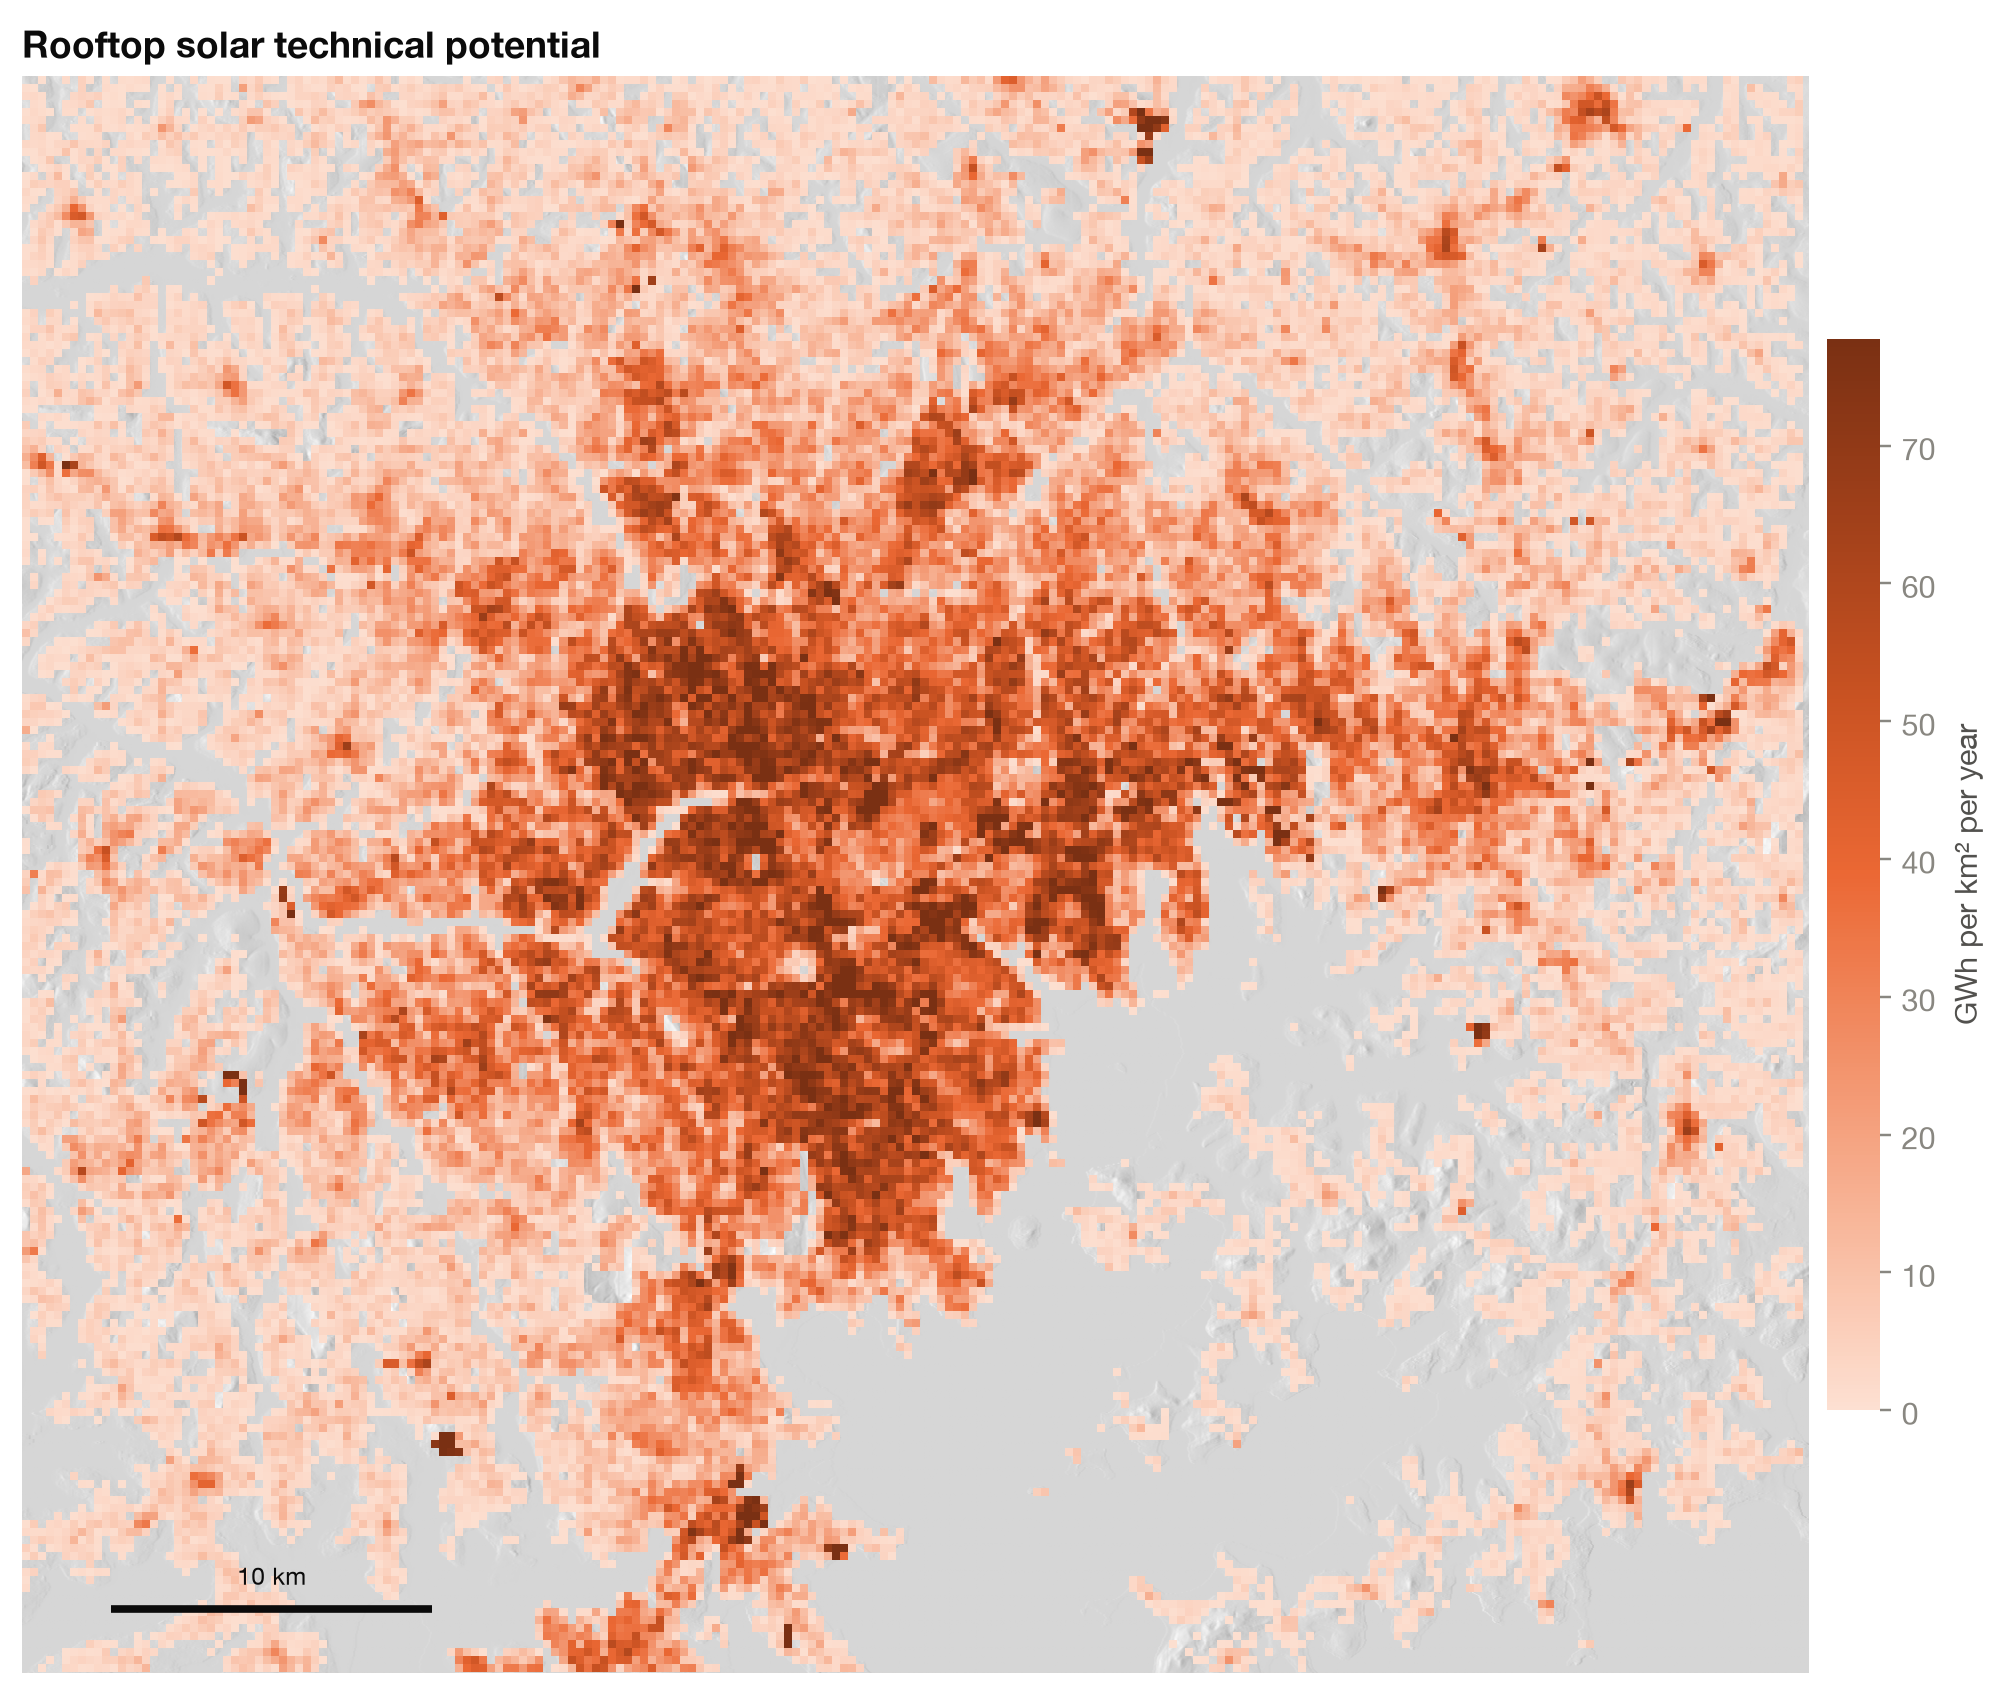
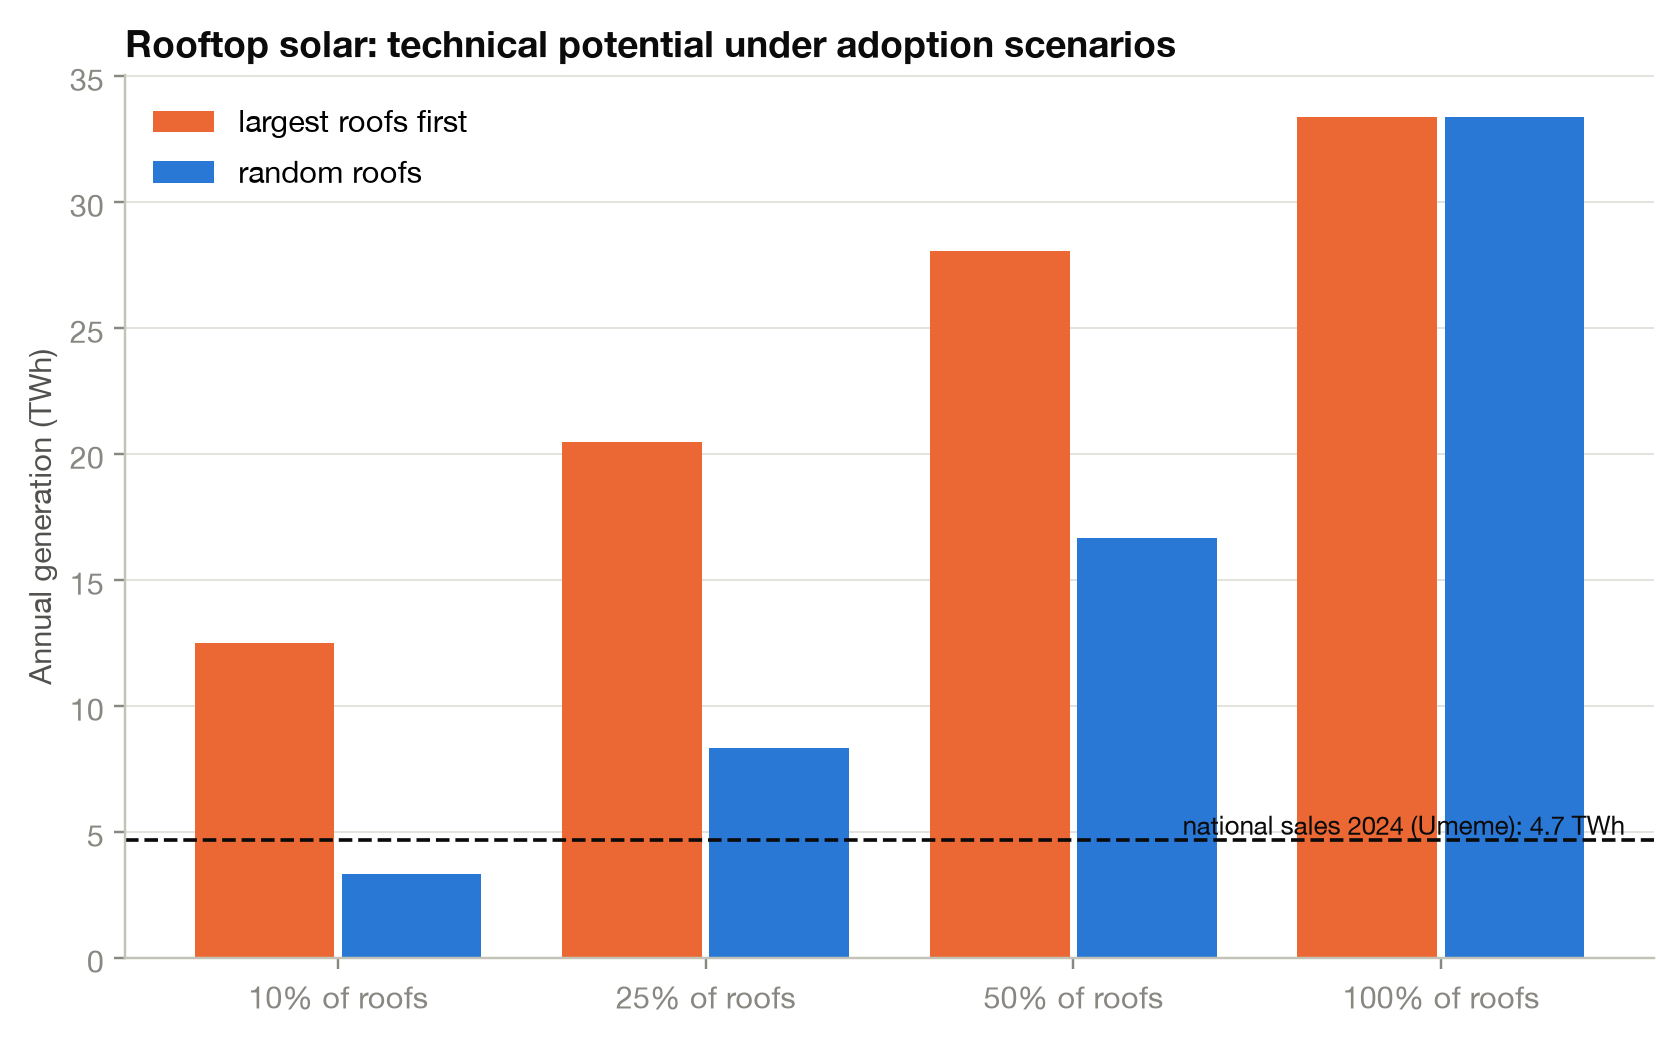
Street trees take about 4 °C off the felt heat (UTCI) where they shade, 14:30Informal district before and after 600 street trees, ground coloured by walking heatAn equinox day with the new street treesThe orientation trade-off: east–west turns cut wall sun but block the lake breezeSolar over a day: CBD roofs and the city's output against average demandThe Kampala cube: central Kampala terrain and buildings coloured by surface heatEquinox day in the CBD: shadows and the sun's pathEquinox day in the informal district (Kawempe): almost no shade at midday21 June: the sun passes north of overhead21 December: the sun passes south of overheadEquinox day at the growth frontierCBD in 3D: annual sunlight on every surface, sun paths, lake breezeInformal district in 3DGrowth frontier in 3DOrbit of the CBD modelLake breeze through the CBD street network (potential flow)Lake breeze through the informal districtLake breeze through the growth frontierBuilding orientation by settlement type, and sun on walls by facing directionGrowth frontier: each building's orientation penaltyInformal district: each building's orientation penaltyThe daily wind cycle: the lake breeze switches on at 09:00Rotating cube of central KampalaThermal classes 2017, 2021, 2025Thermal classes through timeChange in relative surface heat 2017–2025Surface heat by Local Climate ZoneLand cover 2025 and where the city grewUrban growth 2017–2025Land-cover change by classPacked low-rise morphology on 2025 surface heatLiterature check: the 58 informal settlements mapped by SDI/NSDFU/ACTogether (2014, red), georeferenced from their map book, against the morphology layer (blue)Thermal trajectories by settlement typeTree-planting priorityResidents and plantable land per priority classRooftop solar potentialRooftop solar adoption scenarios