What happens when thousands of people, operators, boda riders and shops each make their own choice?
This lab rebuilds the Kiira model as an agent-based model. Households pick how to travel each week, operators learn fares and fleet sizes, boda riders cut prices or leave, and shops decide whether to join a delivery aggregator. The model runs every option for all 100 suburbs over many uncertain futures, then ranks the best three options for each area by what you care about.
New: Kampala's last mile, family by family, a scrolling story in which 9,000 sample families, the boda riders and the shops move as you read. Four more from the same model: 1,200 futures, from Jinja to the street, a shopkeeper's week and a day on the network.
The agents
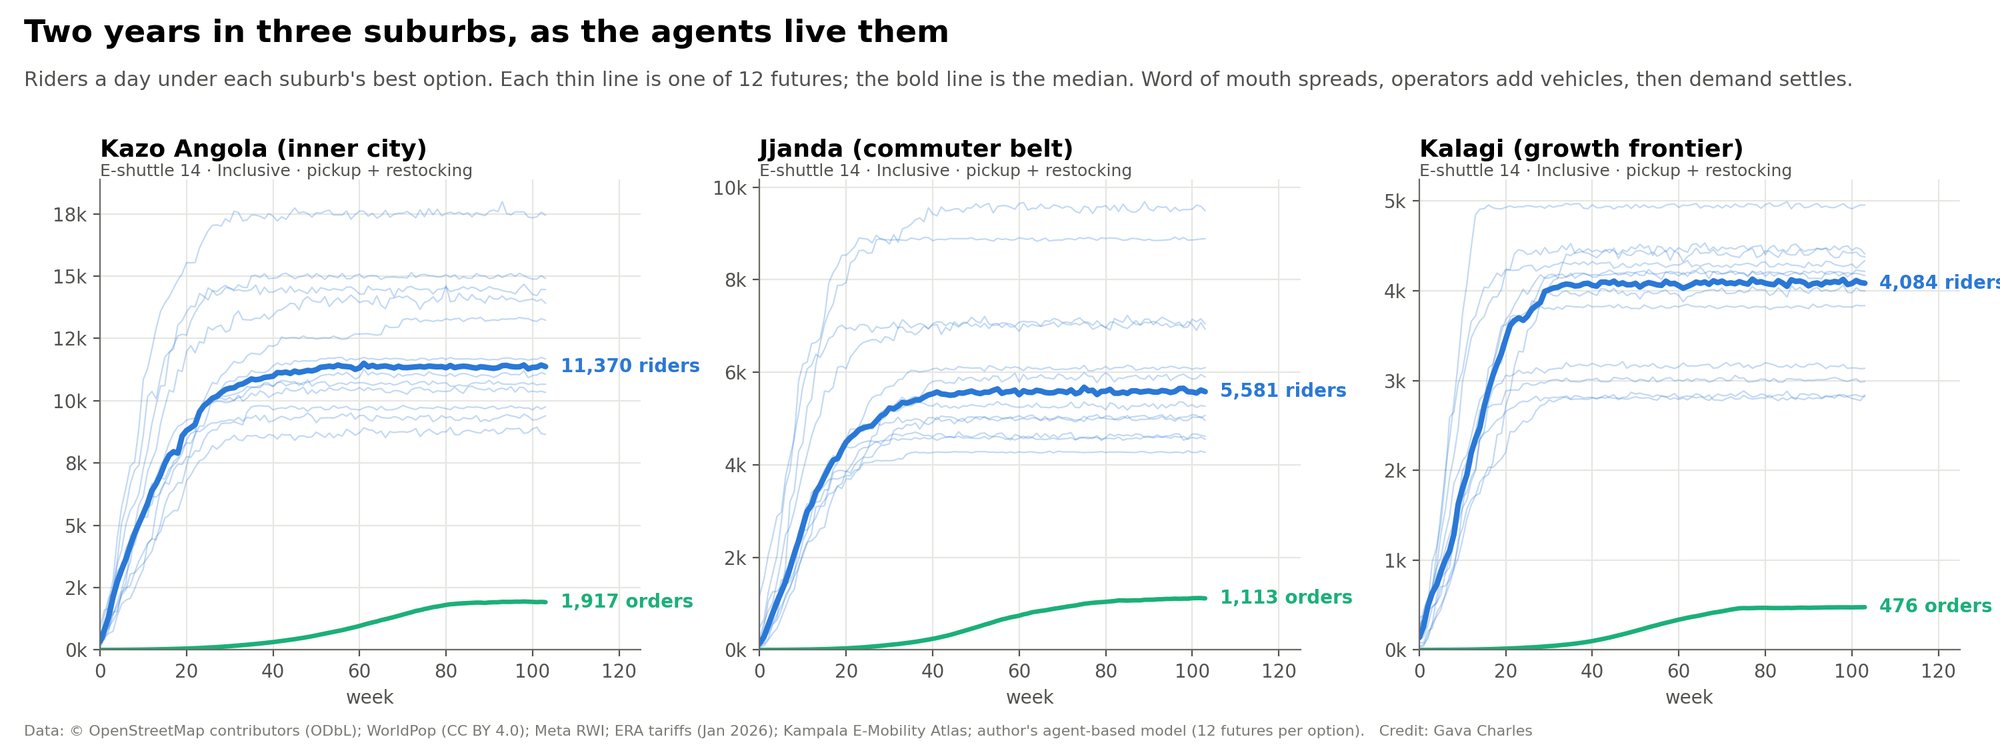
Nothing below is fixed in advance. Ridership, fares, fleet size, boda earnings and orders come out of the agents' choices, week by week, over two years. The network model on the main page finds the best fares in one step. Here people and firms learn, copy each other and react.
Set the priorities and the futures
The first five sliders weight what "best" means, and the map re-ranks at once. The other sliders change the world the agents live in. Press Re-run the agents to simulate all 100 suburbs again in your browser. Every slider is drawn from its range in each future, so the model reports a spread, not one number.
What matters most
The world the agents live in (centre of each uncertain range)
Best three options for each suburb
Hover over a suburb to see its best three options. Tick Charging depots or colour by Year the vehicles arrive to follow the fleet (the story From Jinja to the street tells it). Click it for the full picture and to watch its two years unfold. There are up to 54 options per suburb: three vehicles (Kiira 14-seat e-shuttle, Kayoola 8 m e-midi where roads allow, a diesel 14-seat taxi for comparison), three ways to set fares (flat UGX 1,000, learning dynamic, inclusive with a city transfer discount and a 20% green grant) and six aggregator settings (none, door delivery, pickup at the stop, shop restocking, or door or pickup combined with restocking).
Pick a suburb
Hover for the best three; click for detail, the week-by-week film and every option with its spread across futures.
How families are affected
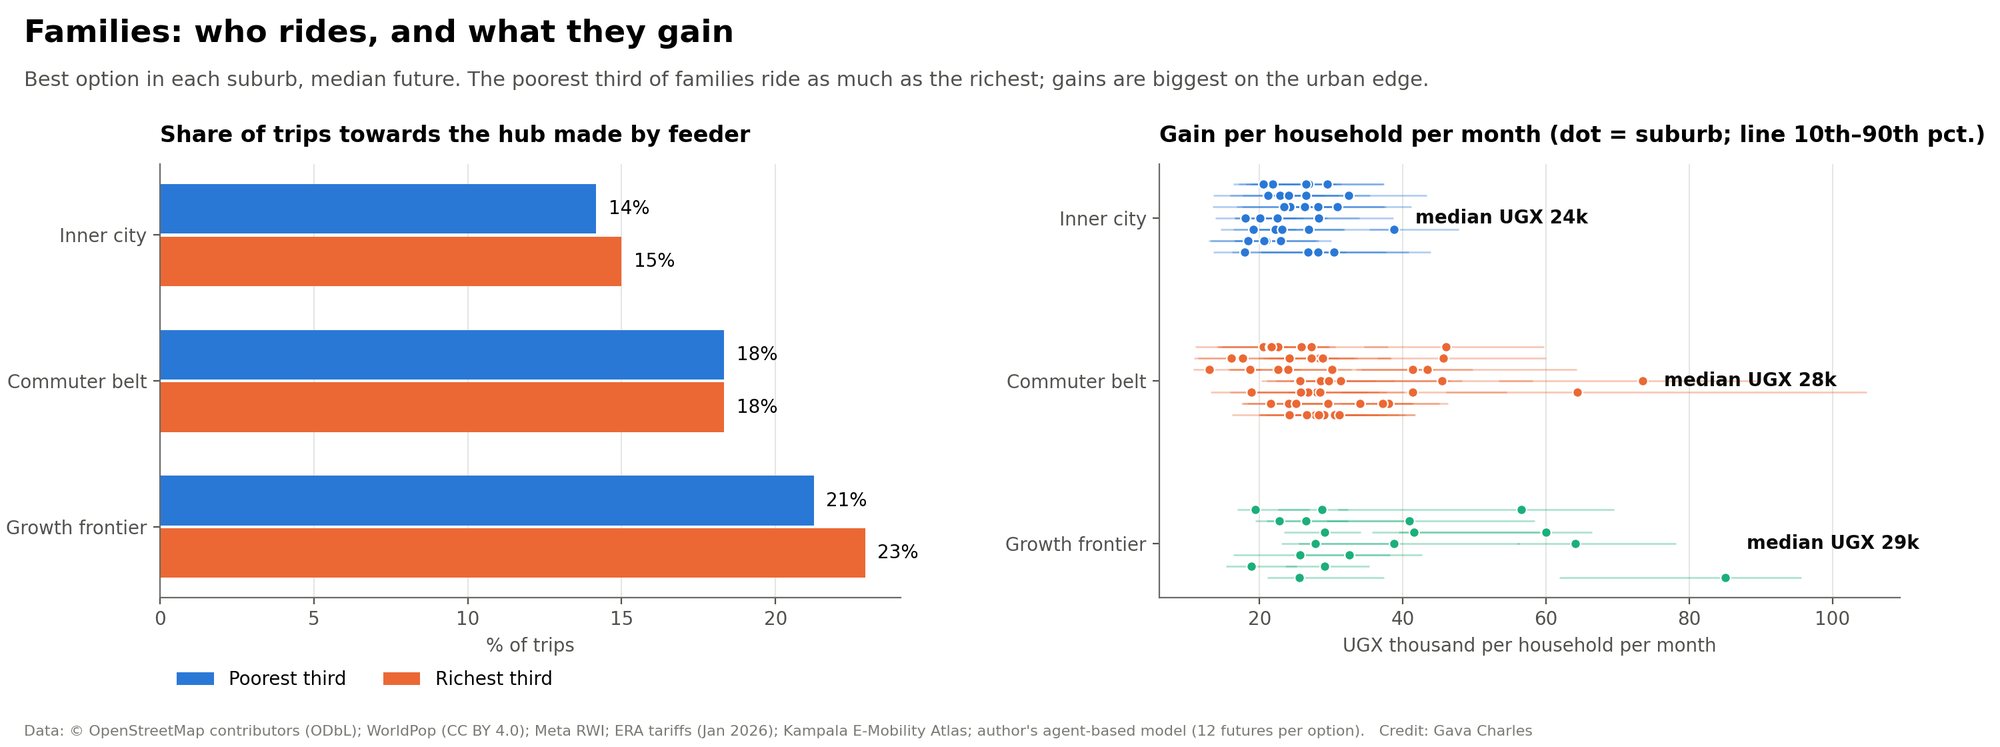
The gain per household combines money and time: shorter walks, less waiting, cheaper trips than a boda and fewer shopping trips, minus fares that replace walking. It is the standard "logsum" measure from the choice model, counted in shillings a month. Bodas lose trips, so their riders' families are shown separately.
Who uses the feeder, by family income
Share of trips heading towards the hub that are made by feeder, for the poorest and richest thirds of sample families, under each suburb's best option (median of futures).
Gain per household by segment
UGX per household per month. Each dot is a suburb (best option, median future, coloured by option); the line spans the 10th to 90th percentile of futures for that suburb.
Four families
Employment
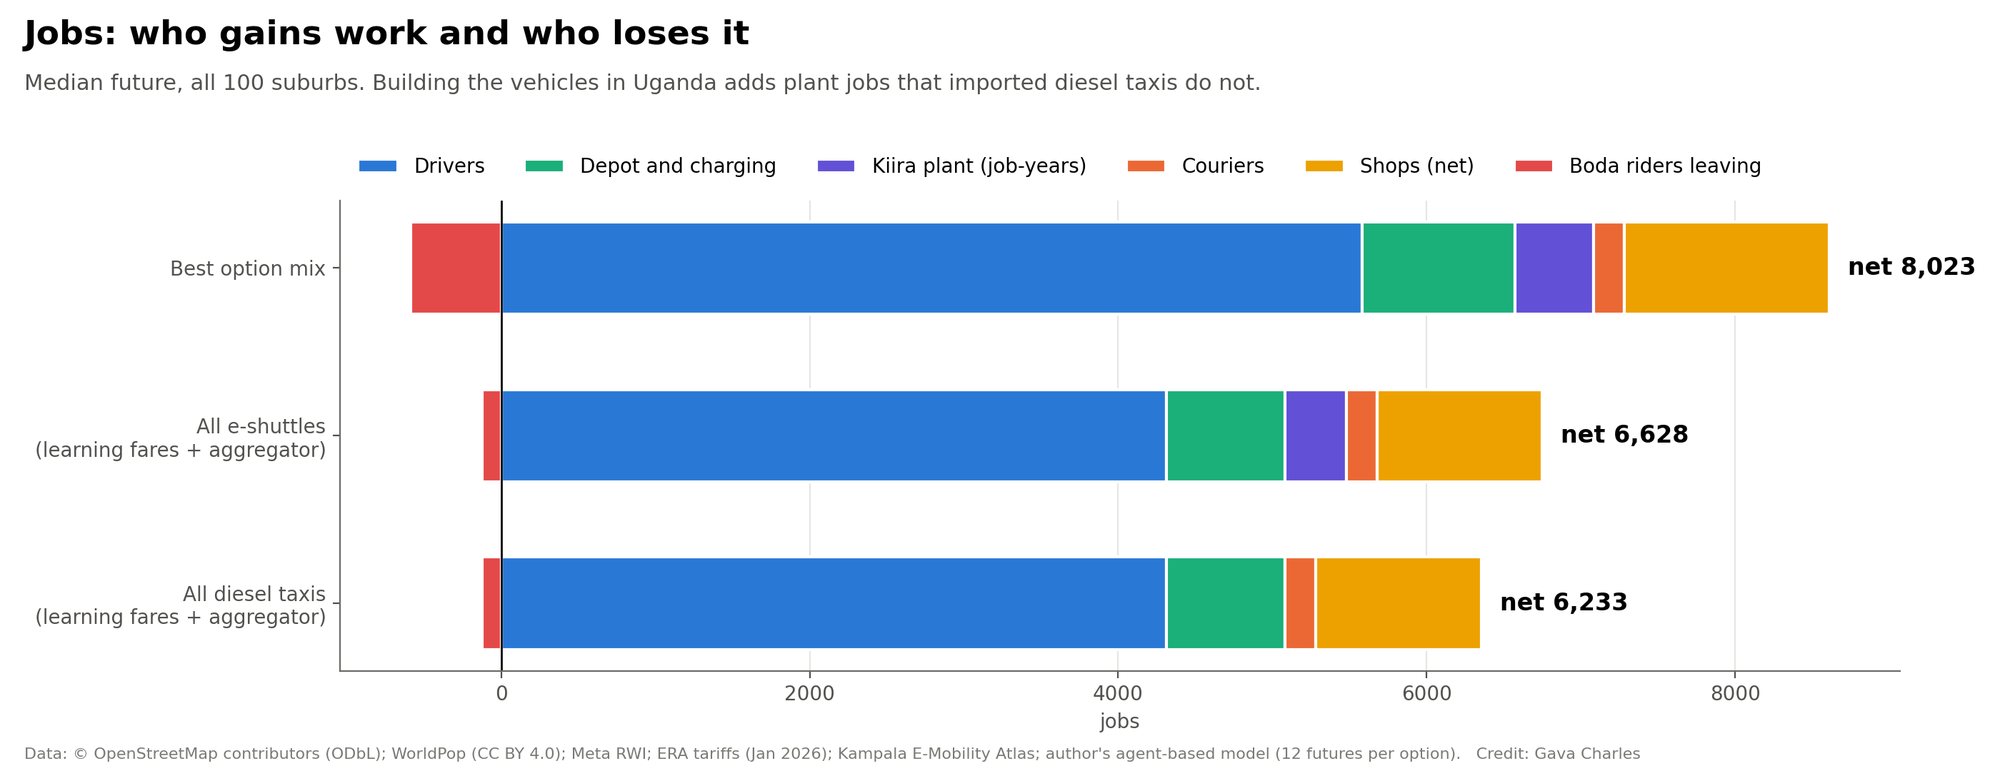
Jobs created by driving, depots and charging, plant assembly, couriers and shop sales, minus boda riders who leave the trade. Kiira-built vehicles add plant jobs that imported diesel taxis do not.
Routes
Each feeder runs from inside the suburb to its nearest trunk hub. The map's feeder lines are drawn thicker where more people ride. The table lists every route under its best option.
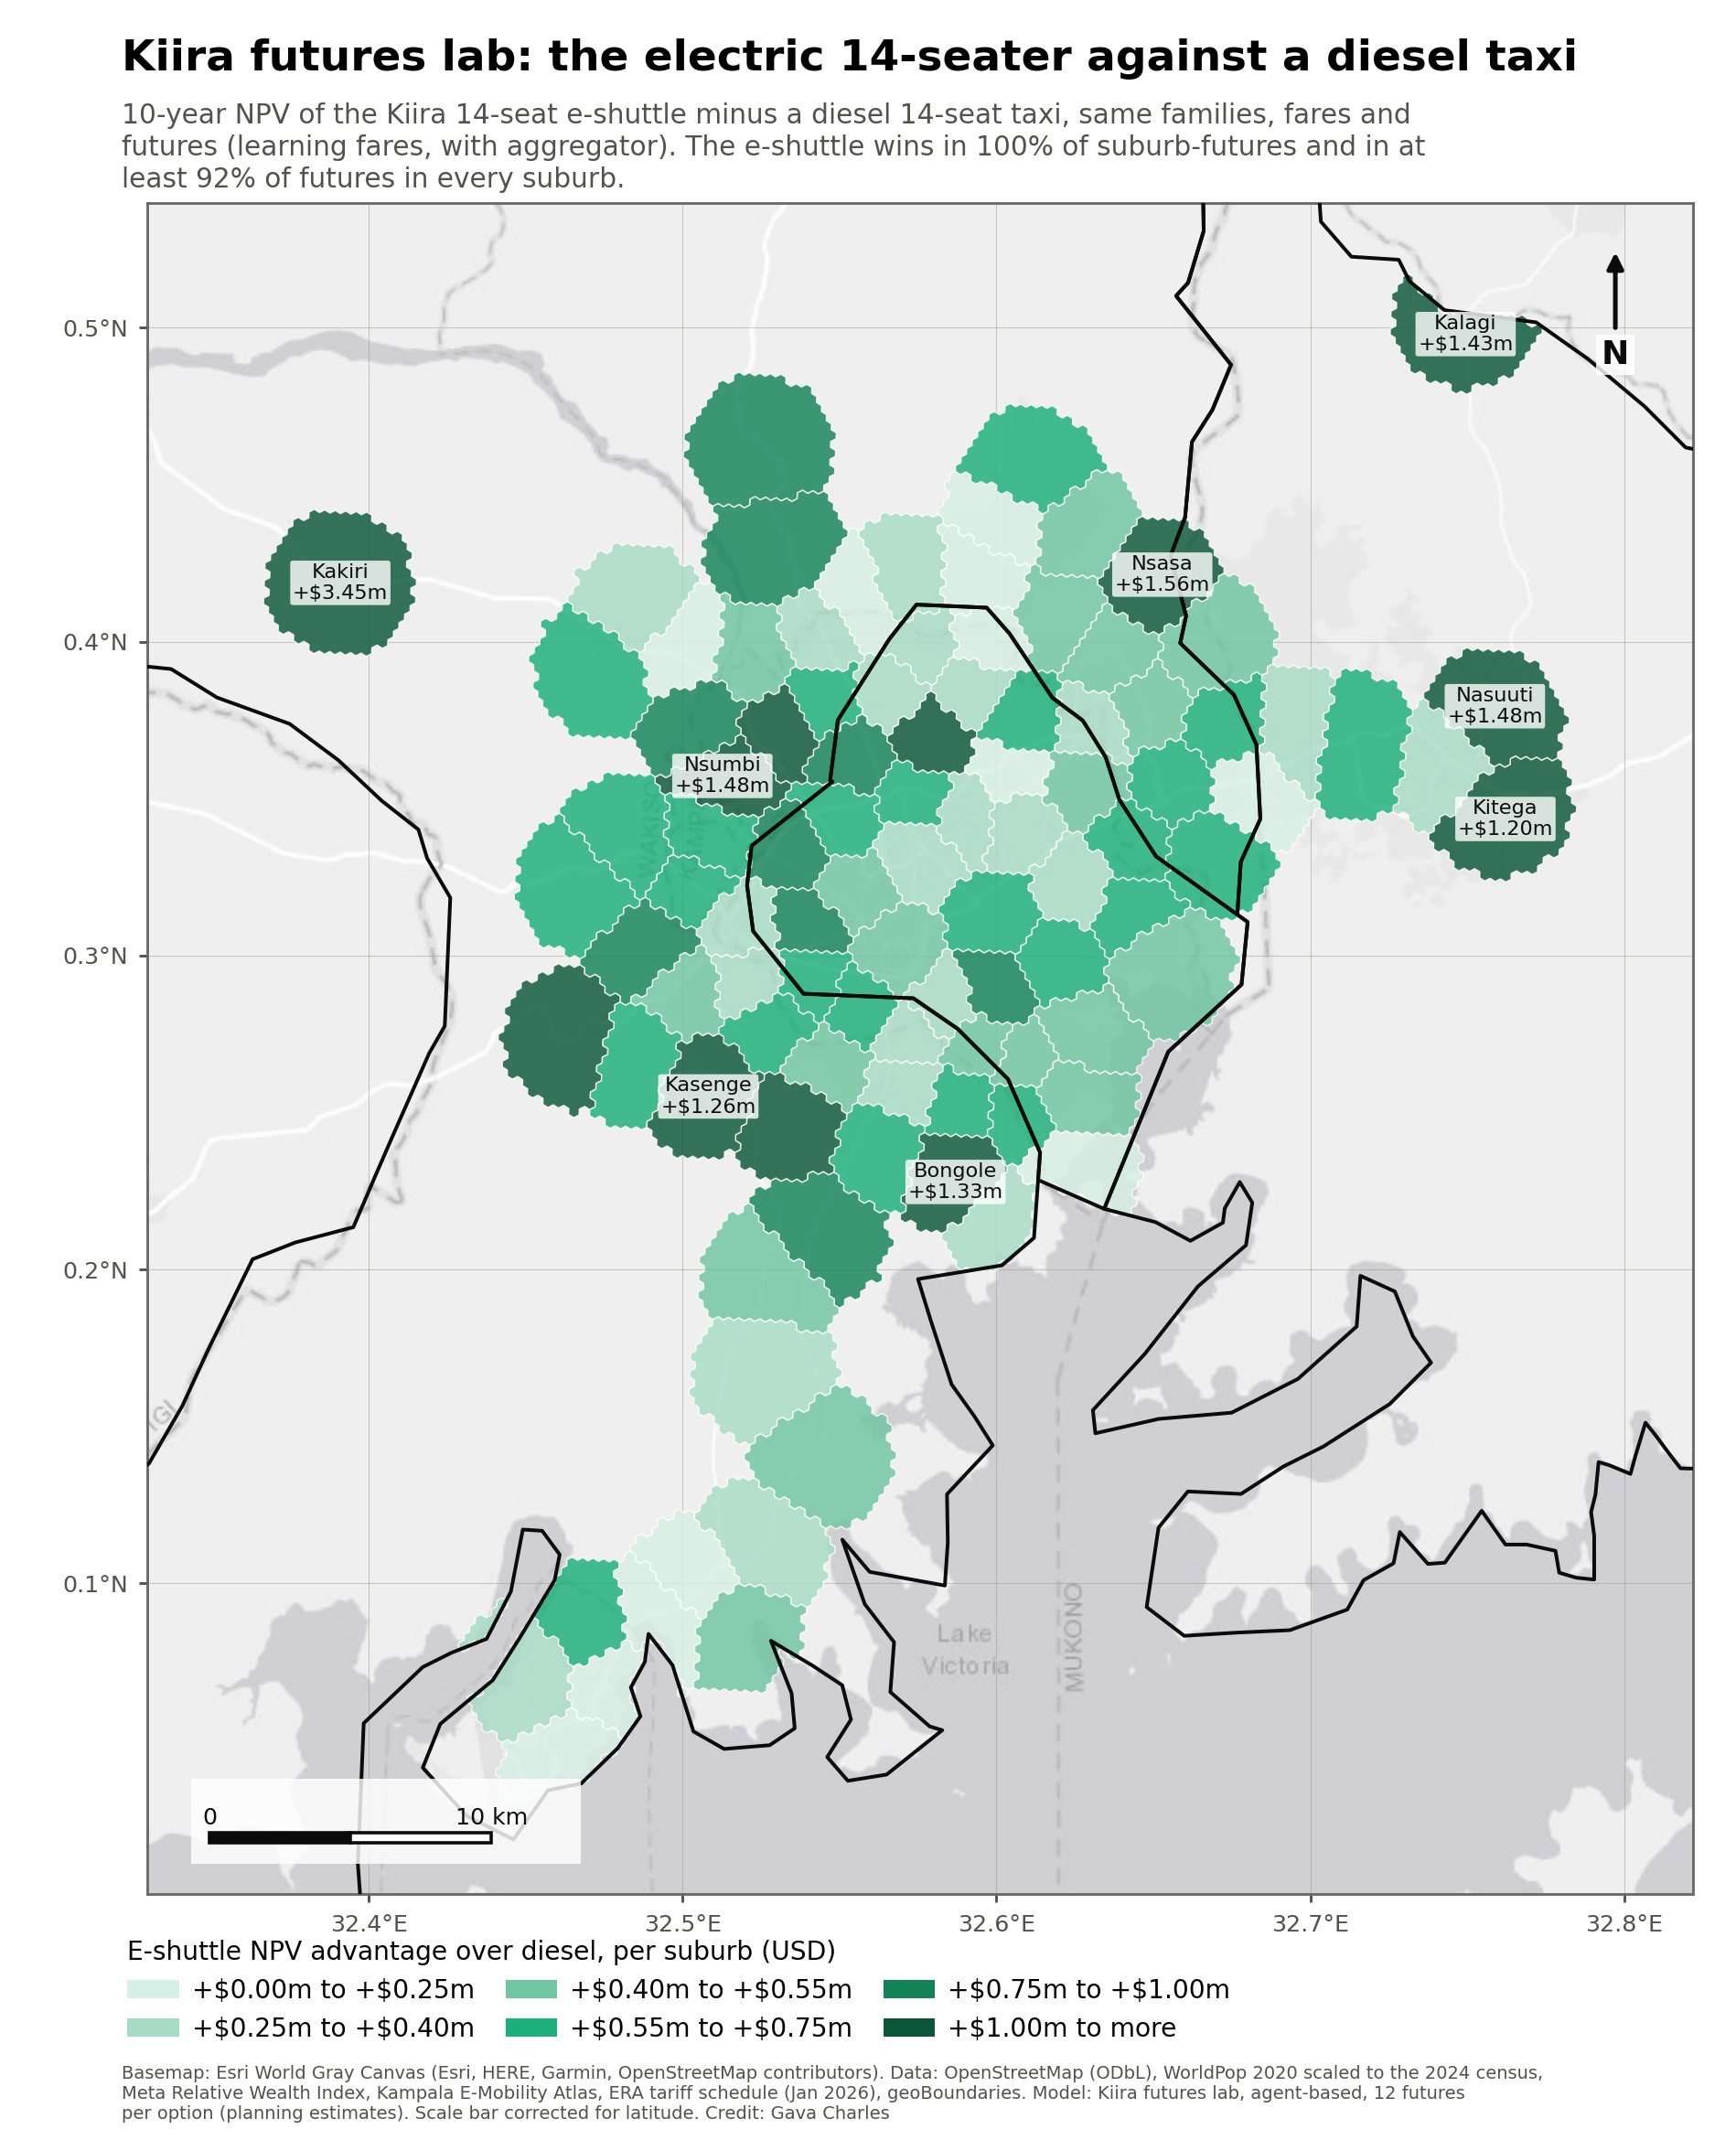
The case for the electric 14-seater
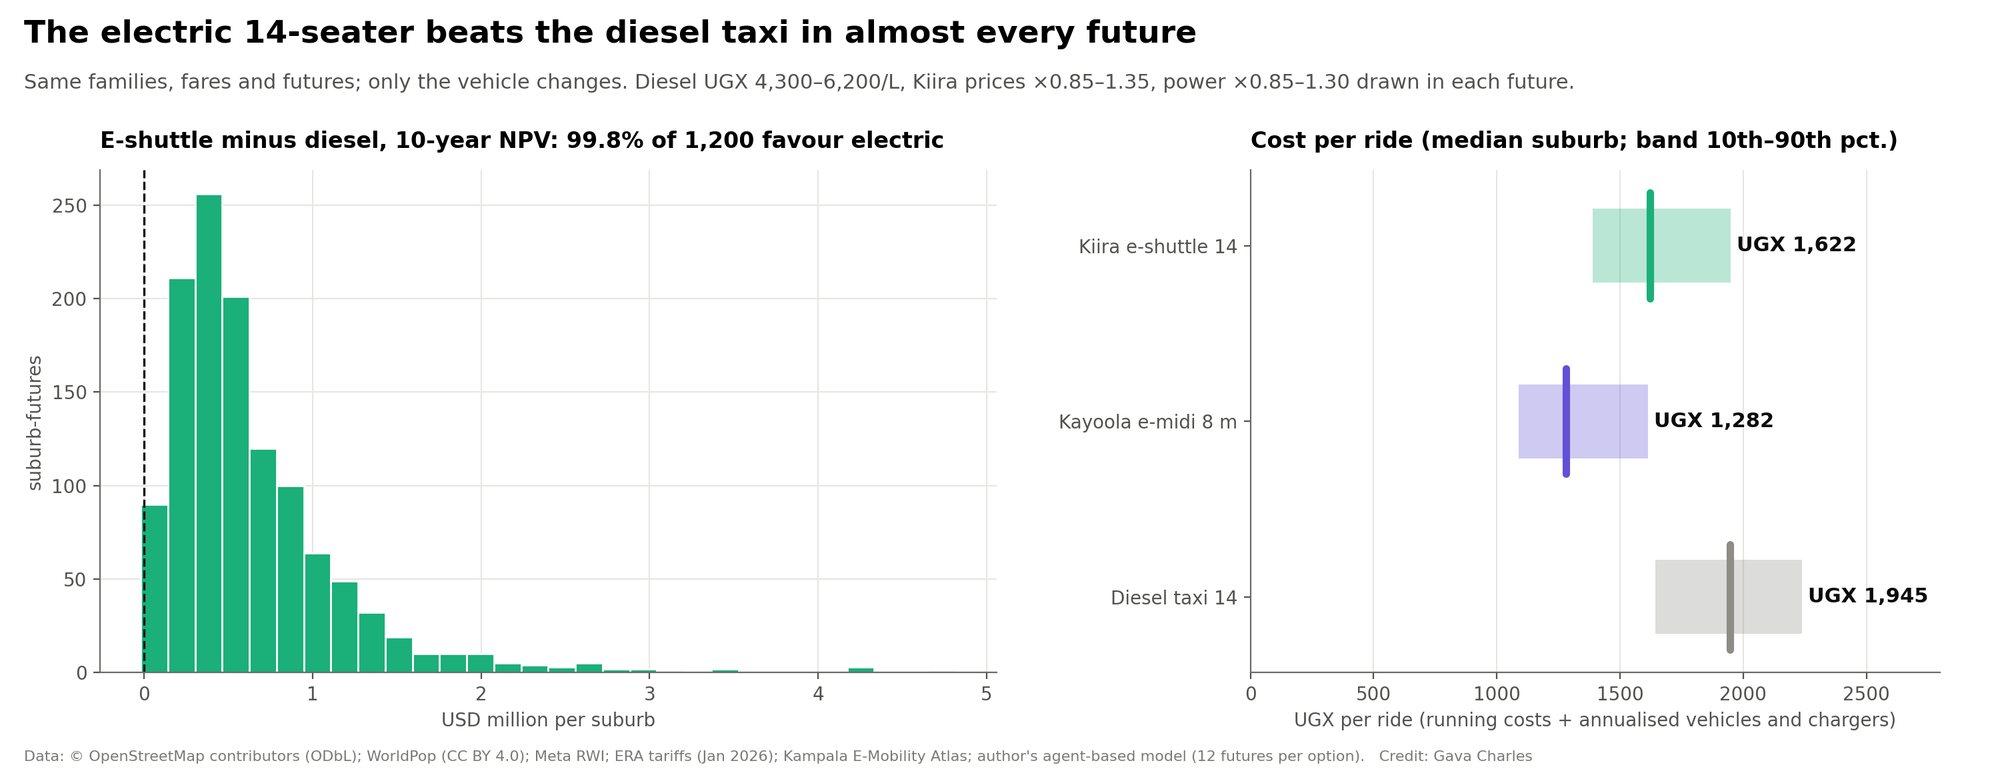
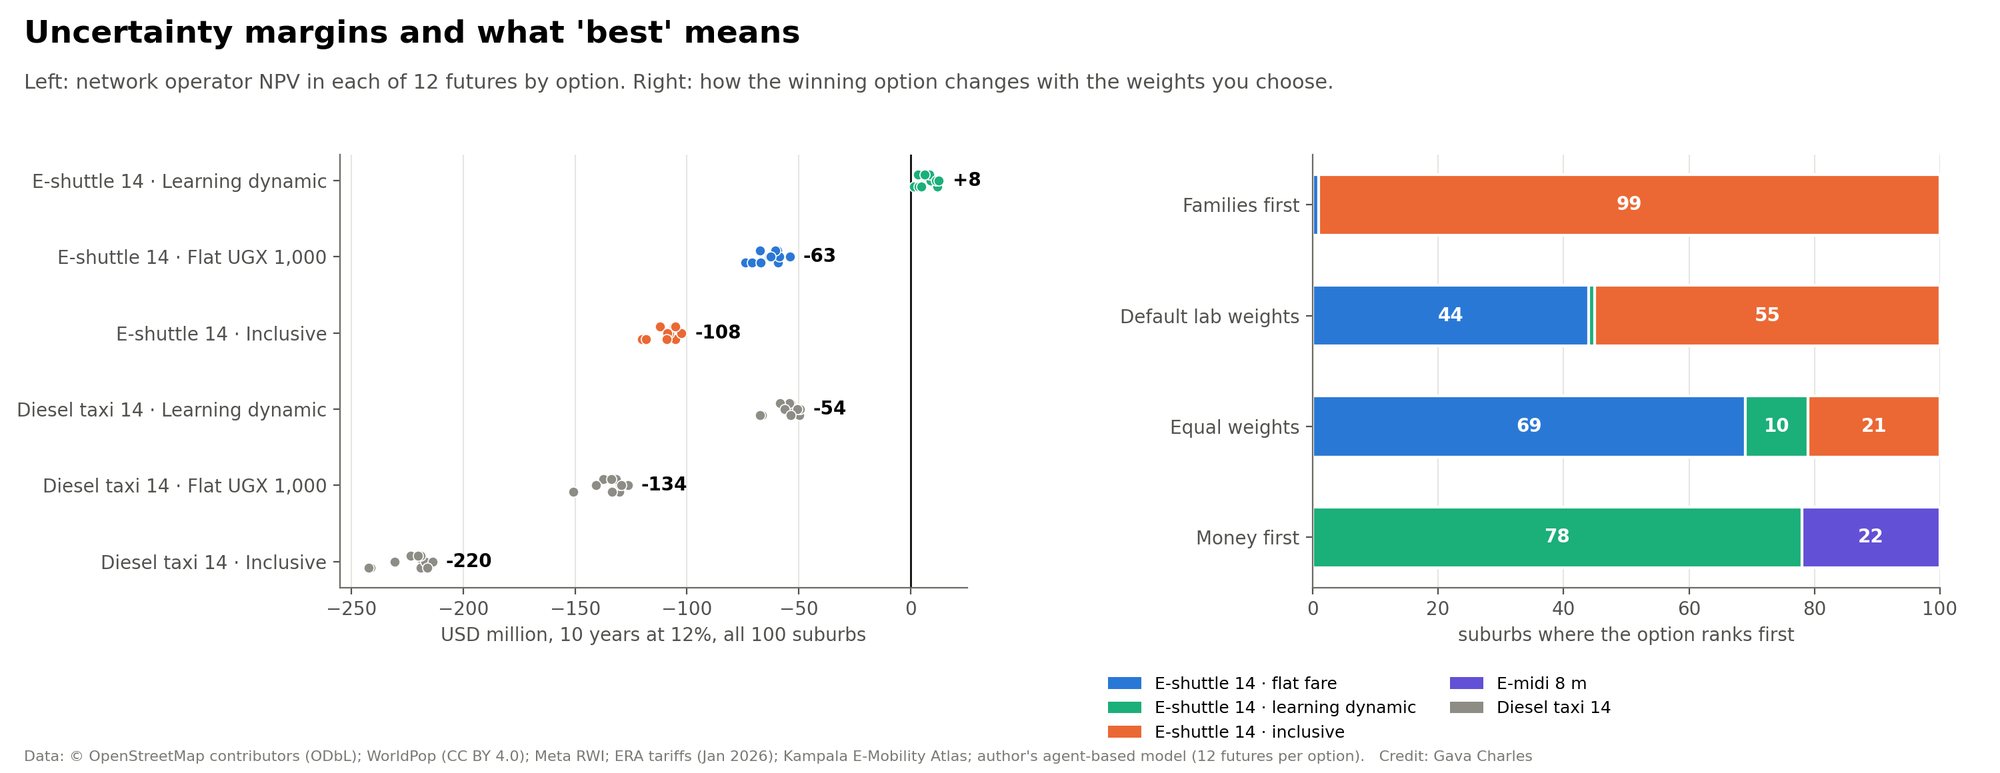
The same families, the same fares and the same futures, with only the vehicle changed. The e-shuttle costs more to buy but far less to run: power at UGX ~450/kWh on the off-peak tariff against diesel at about UGX 5,000/L. Every future draws diesel prices, Kiira prices and electricity prices from wide ranges.
E-shuttle NPV minus diesel taxi NPV, every suburb and future
Learning-dynamic fares, with pickup and restocking. Bars to the right of zero are futures where the e-shuttle earns more over 10 years.
Cost per ride by vehicle
Running costs plus annualised vehicles and chargers, per ride. Median across suburbs; the band spans the 10th to 90th percentile of futures.
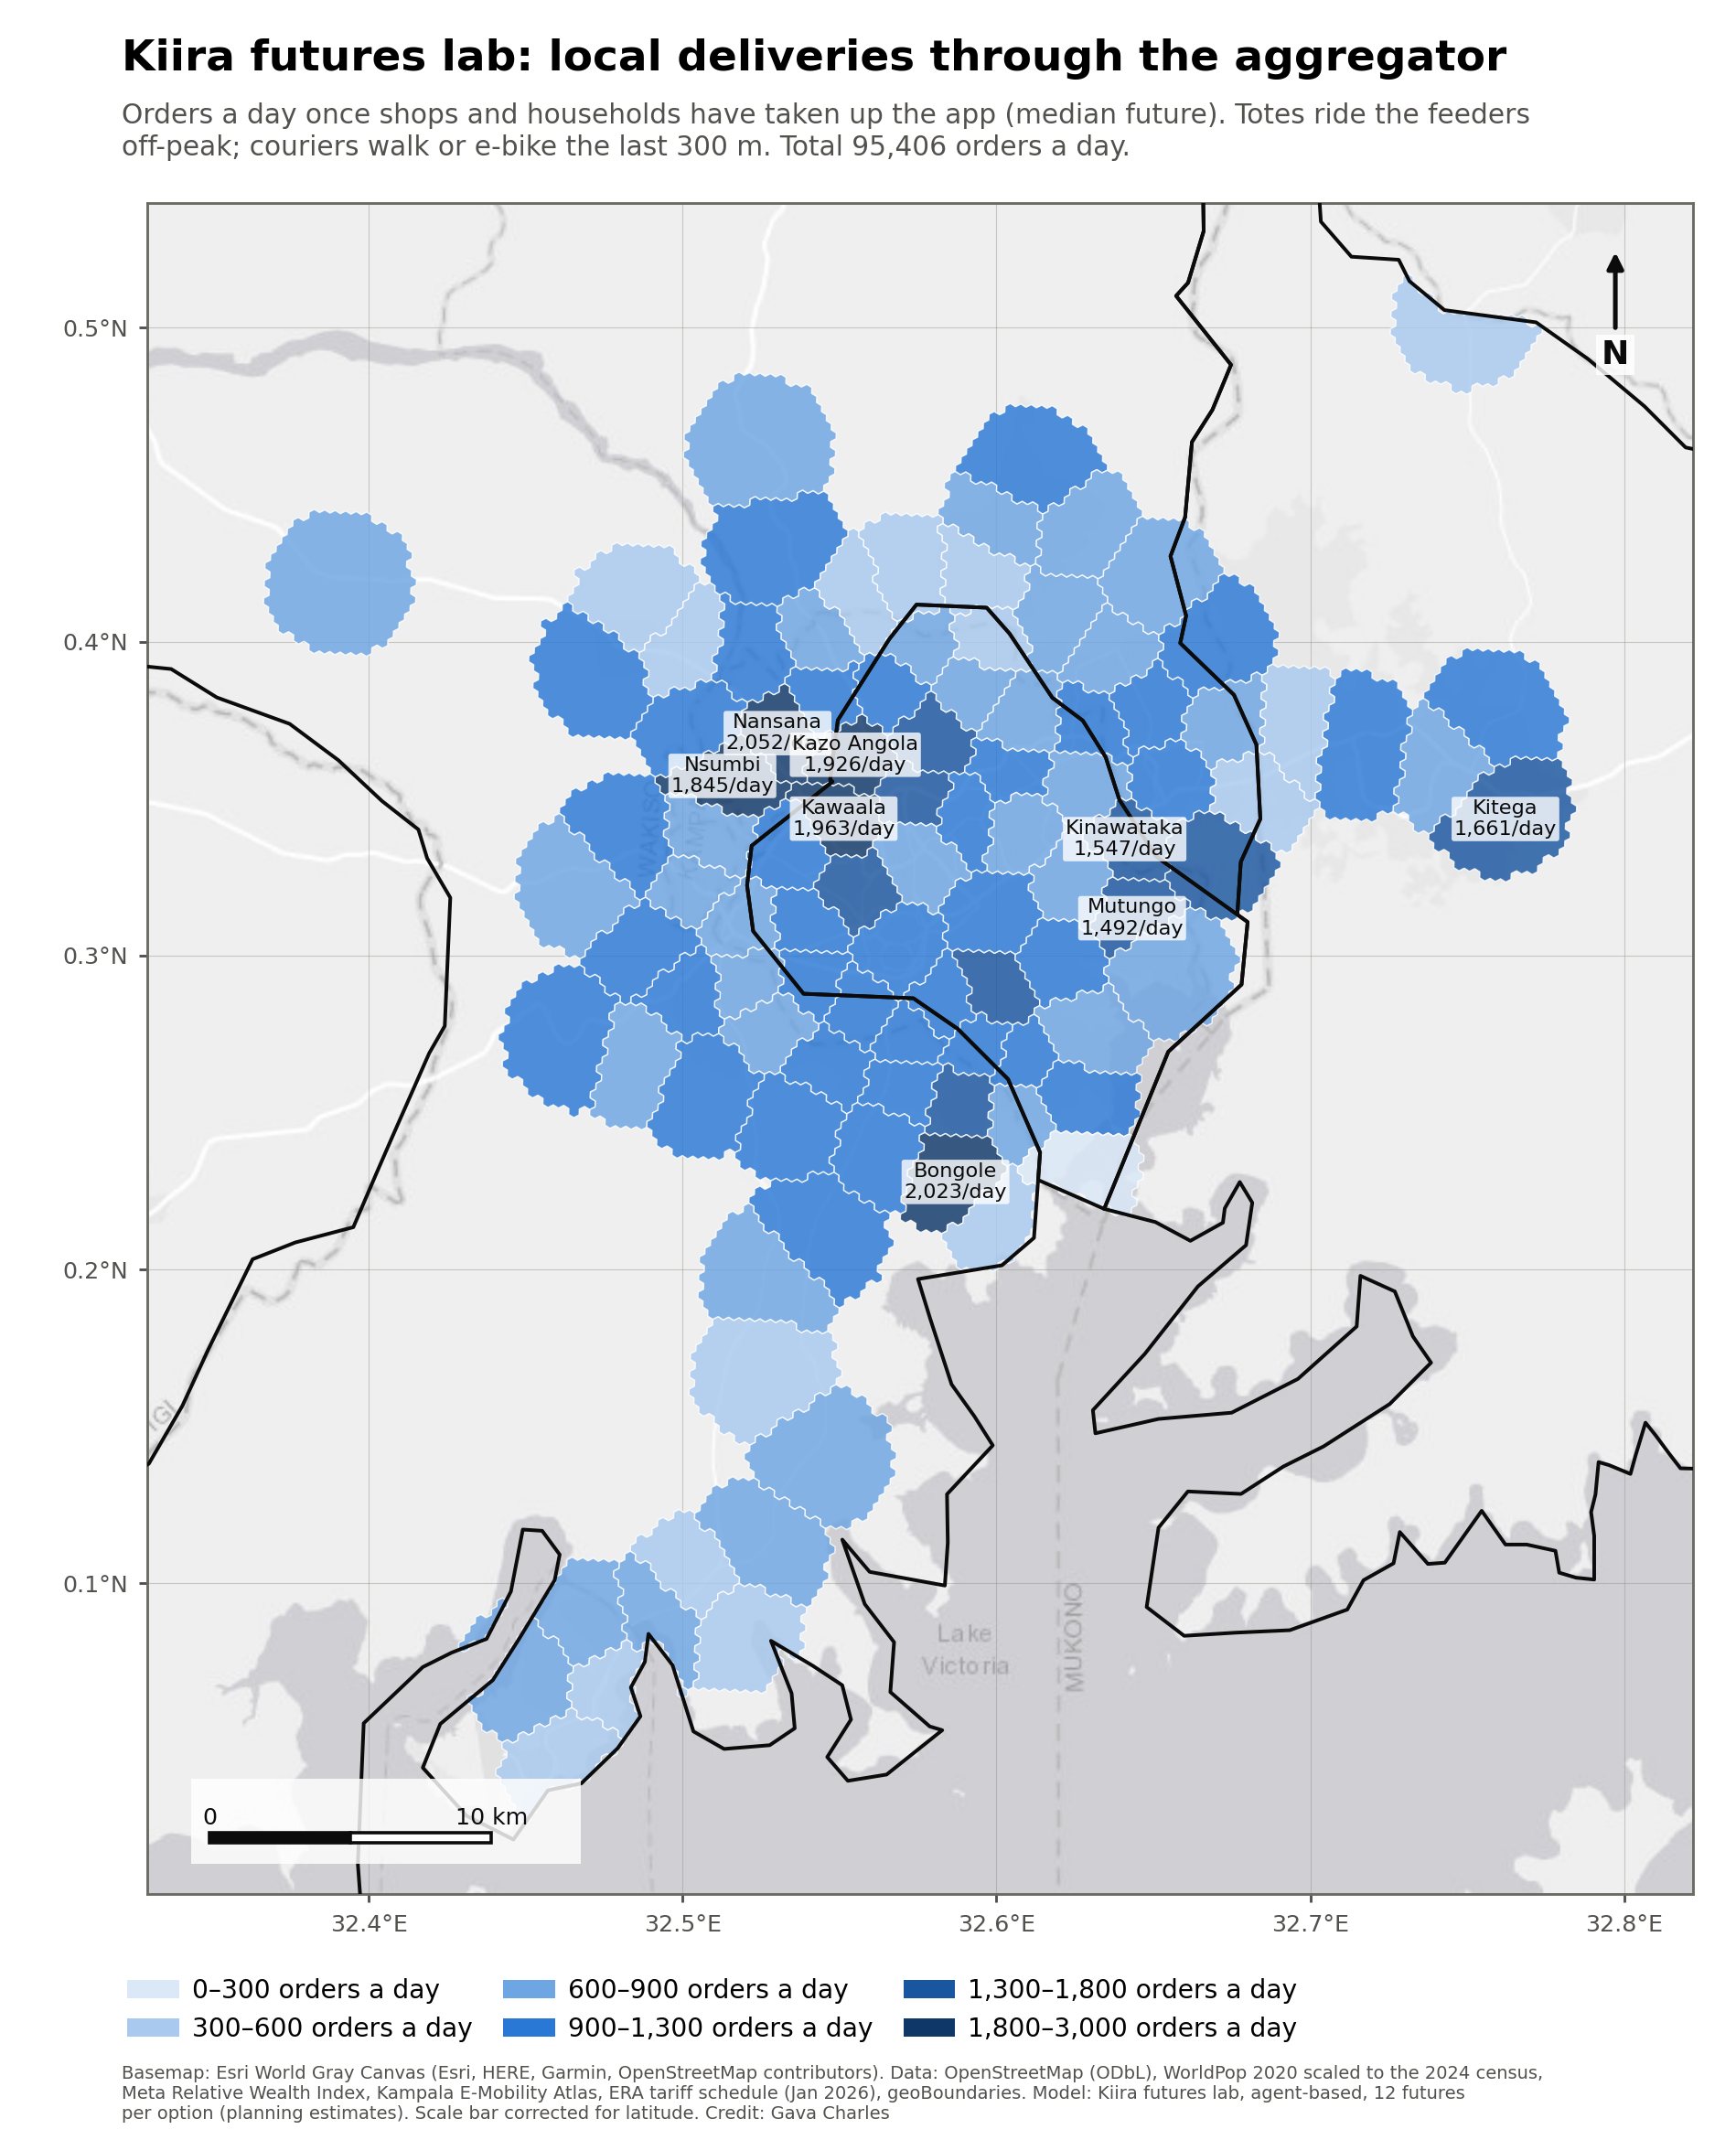
The aggregator: delivery, pickup and shop restocking
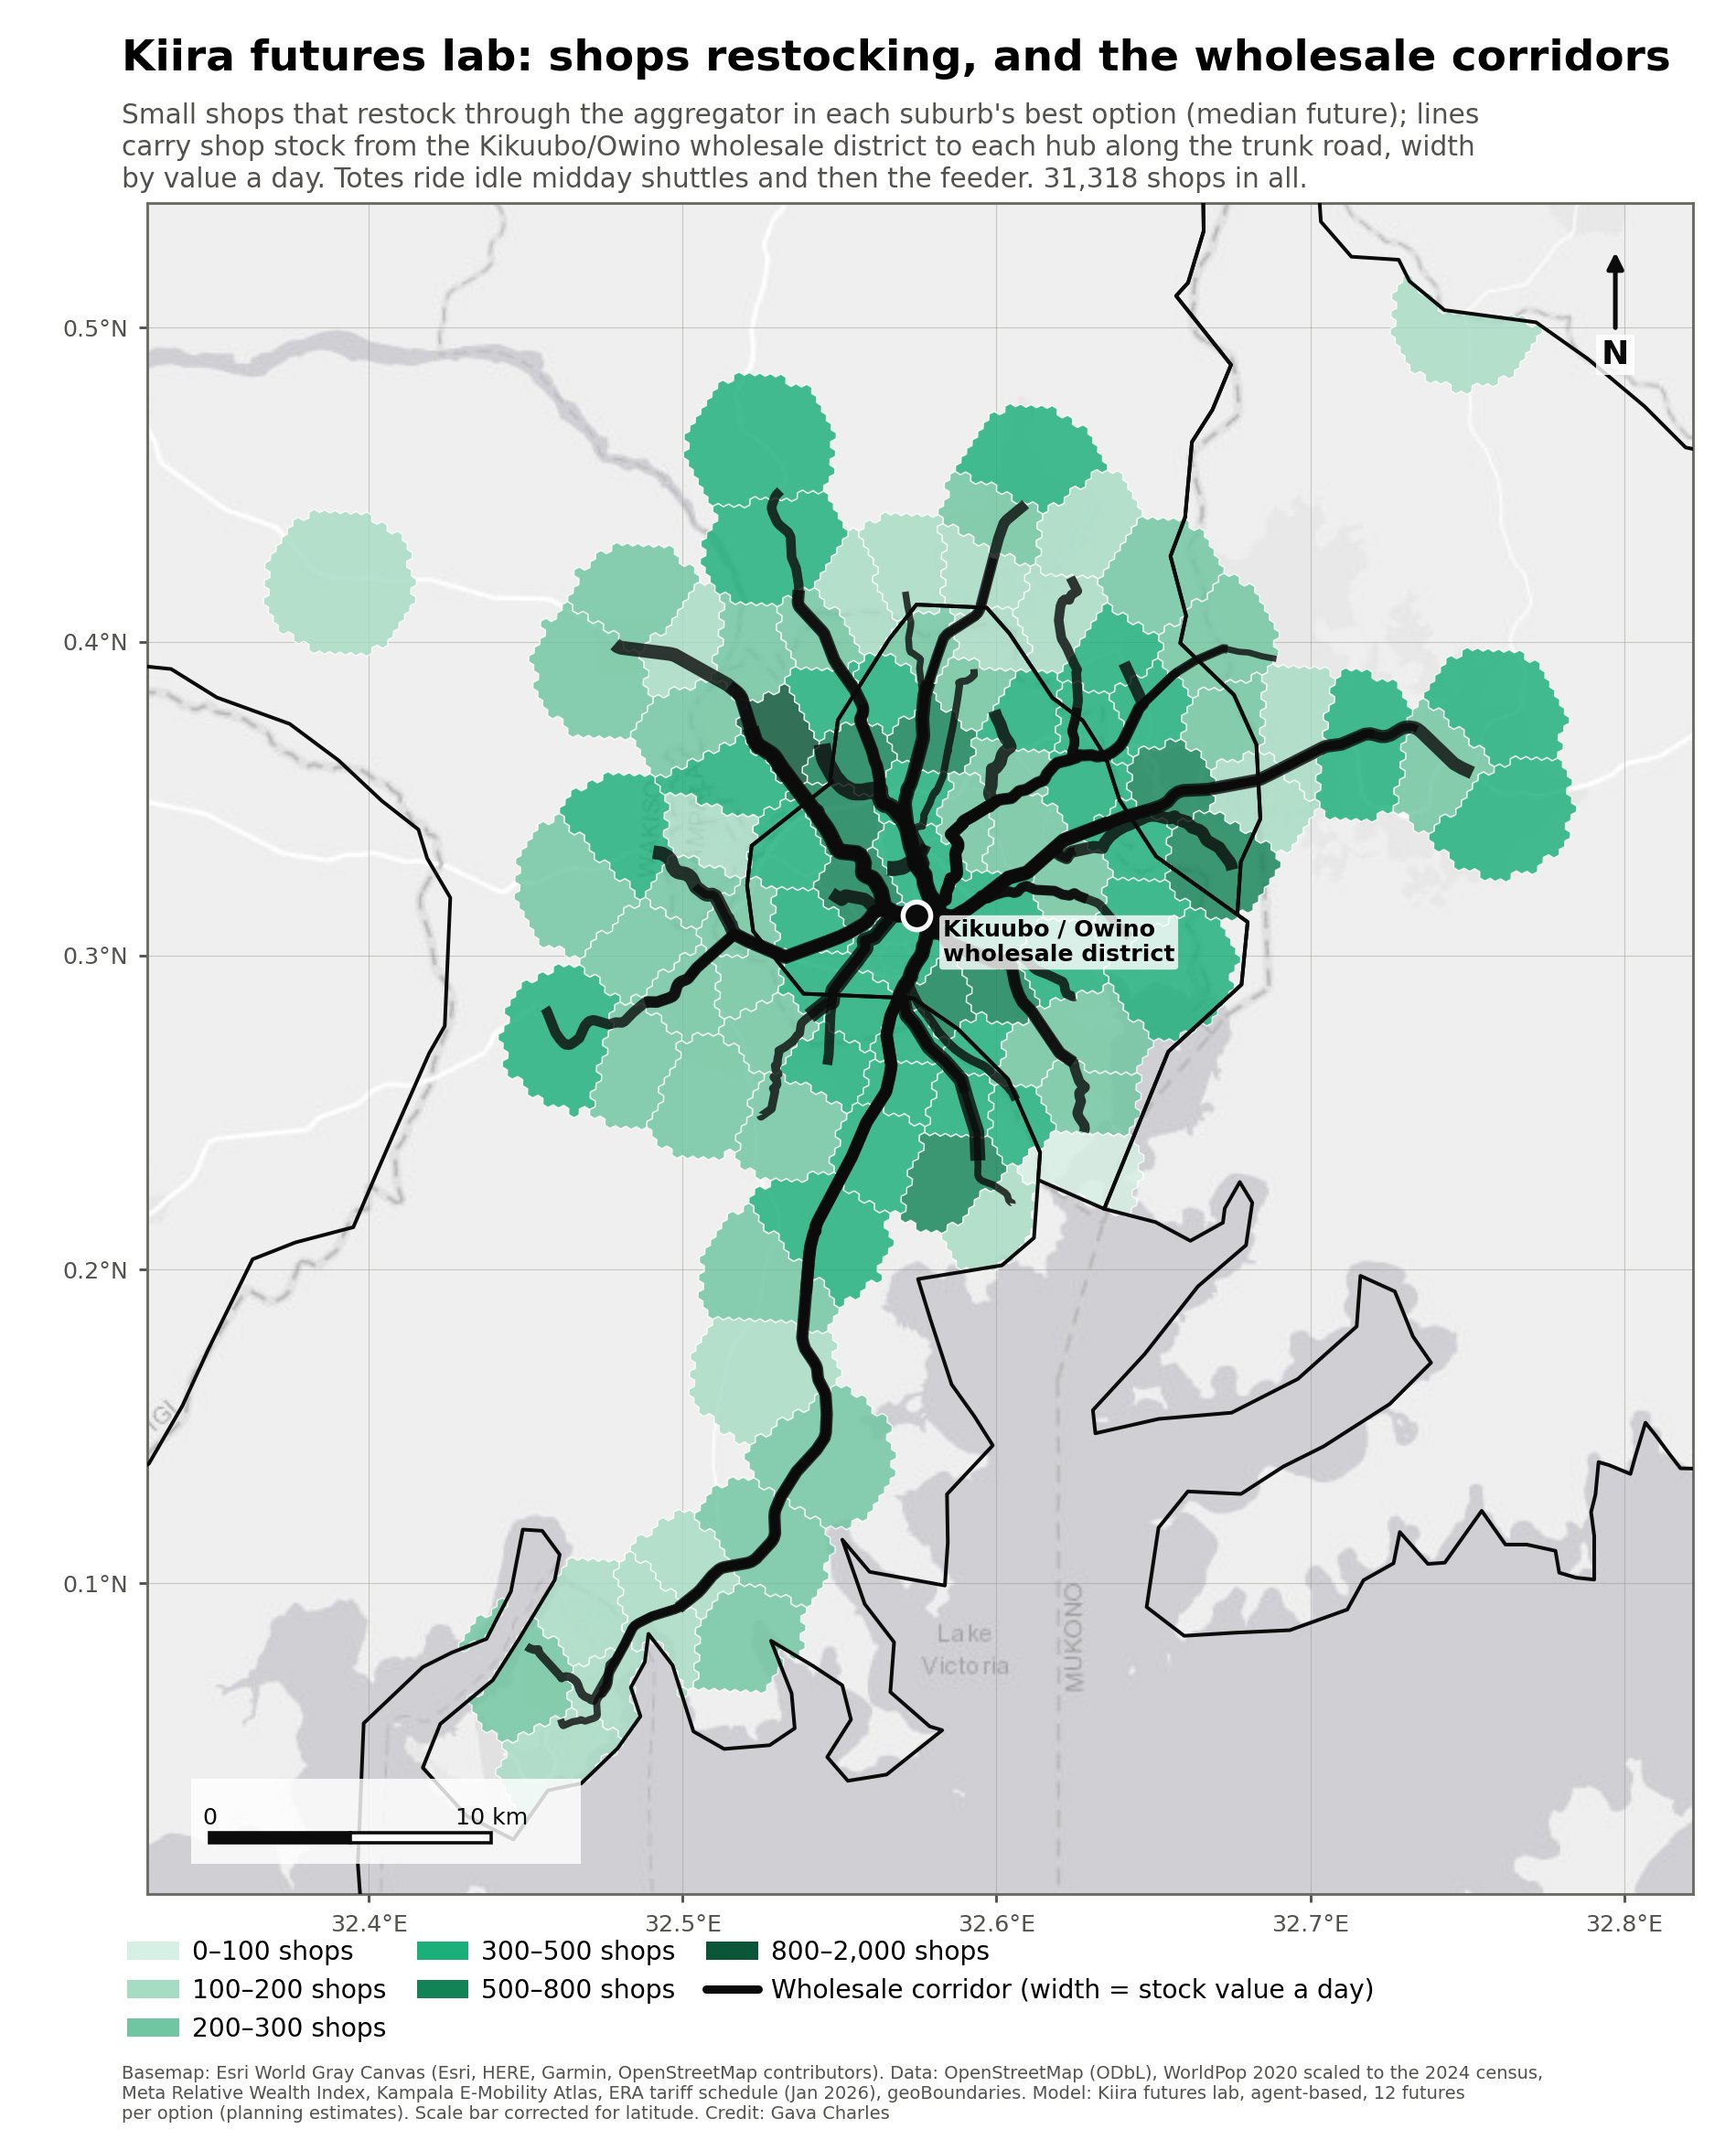
The same shuttles can carry goods in their quiet hours. The model tests six settings in every suburb and every future. Households can order from nearby shops for door delivery (a boda rider does the last hop) or pickup at the stop (a locker or kiosk). Small shops can restock from the wholesale district. Totes ride to the hub and then on the feeder, so the shopkeeper no longer closes for half a day to fetch stock, and can buy on two-week credit. Shop locations come from OpenStreetMap: only about a third of mapped shops are within 300 m of their feeder route, so most restock drops need a boda for the last hop.
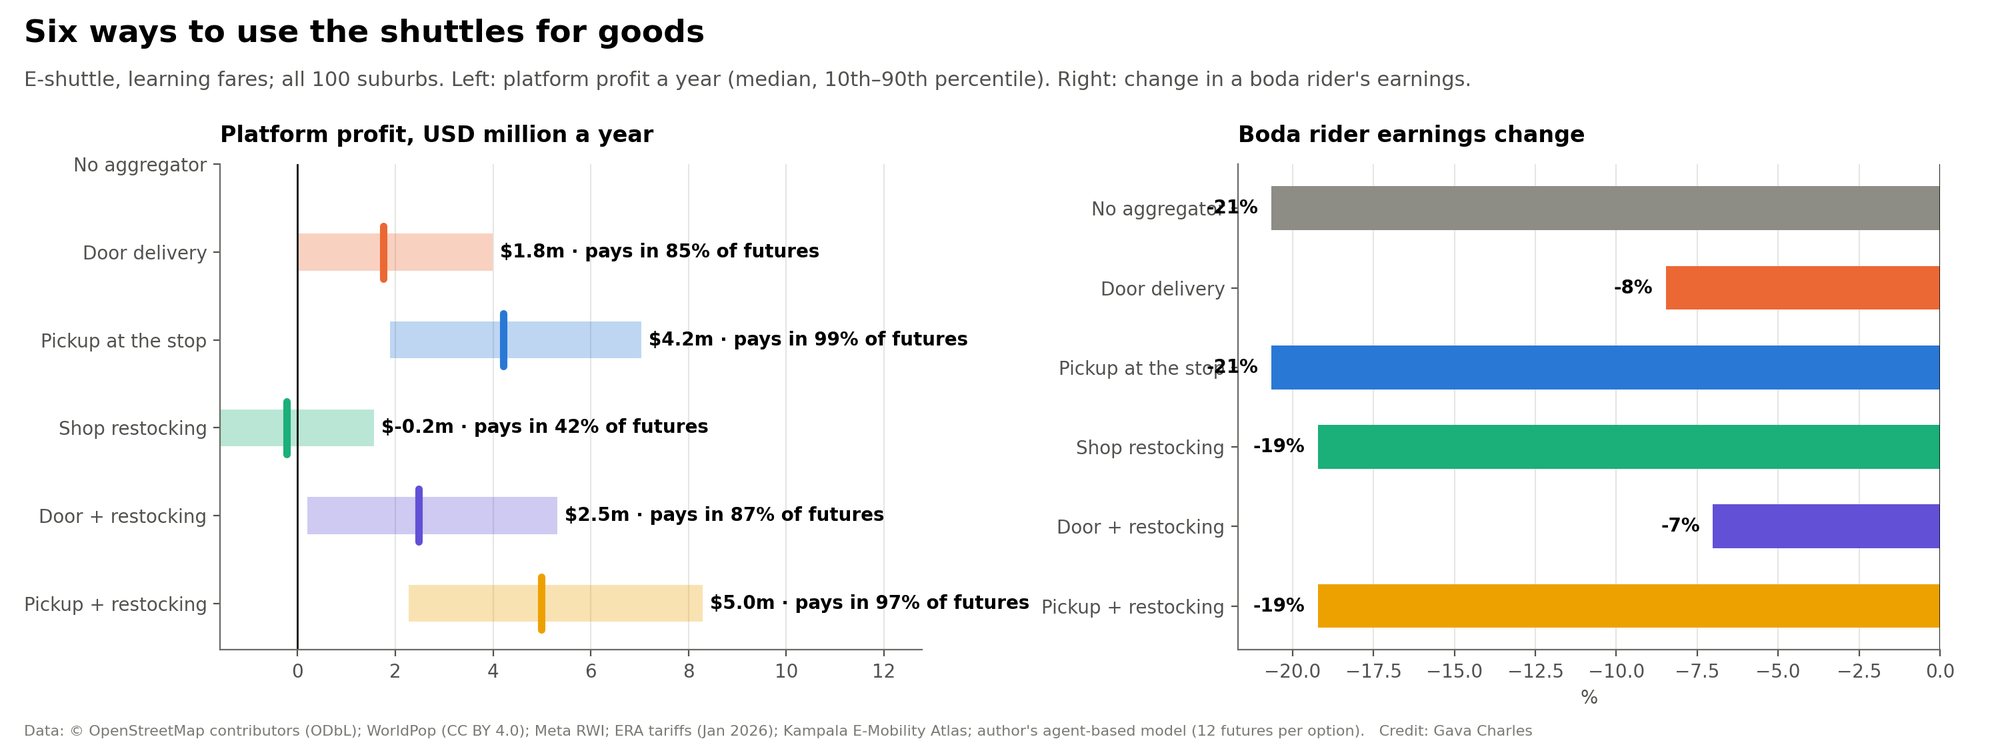
Six settings compared (e-shuttle, learning fares; all 100 suburbs, median future)
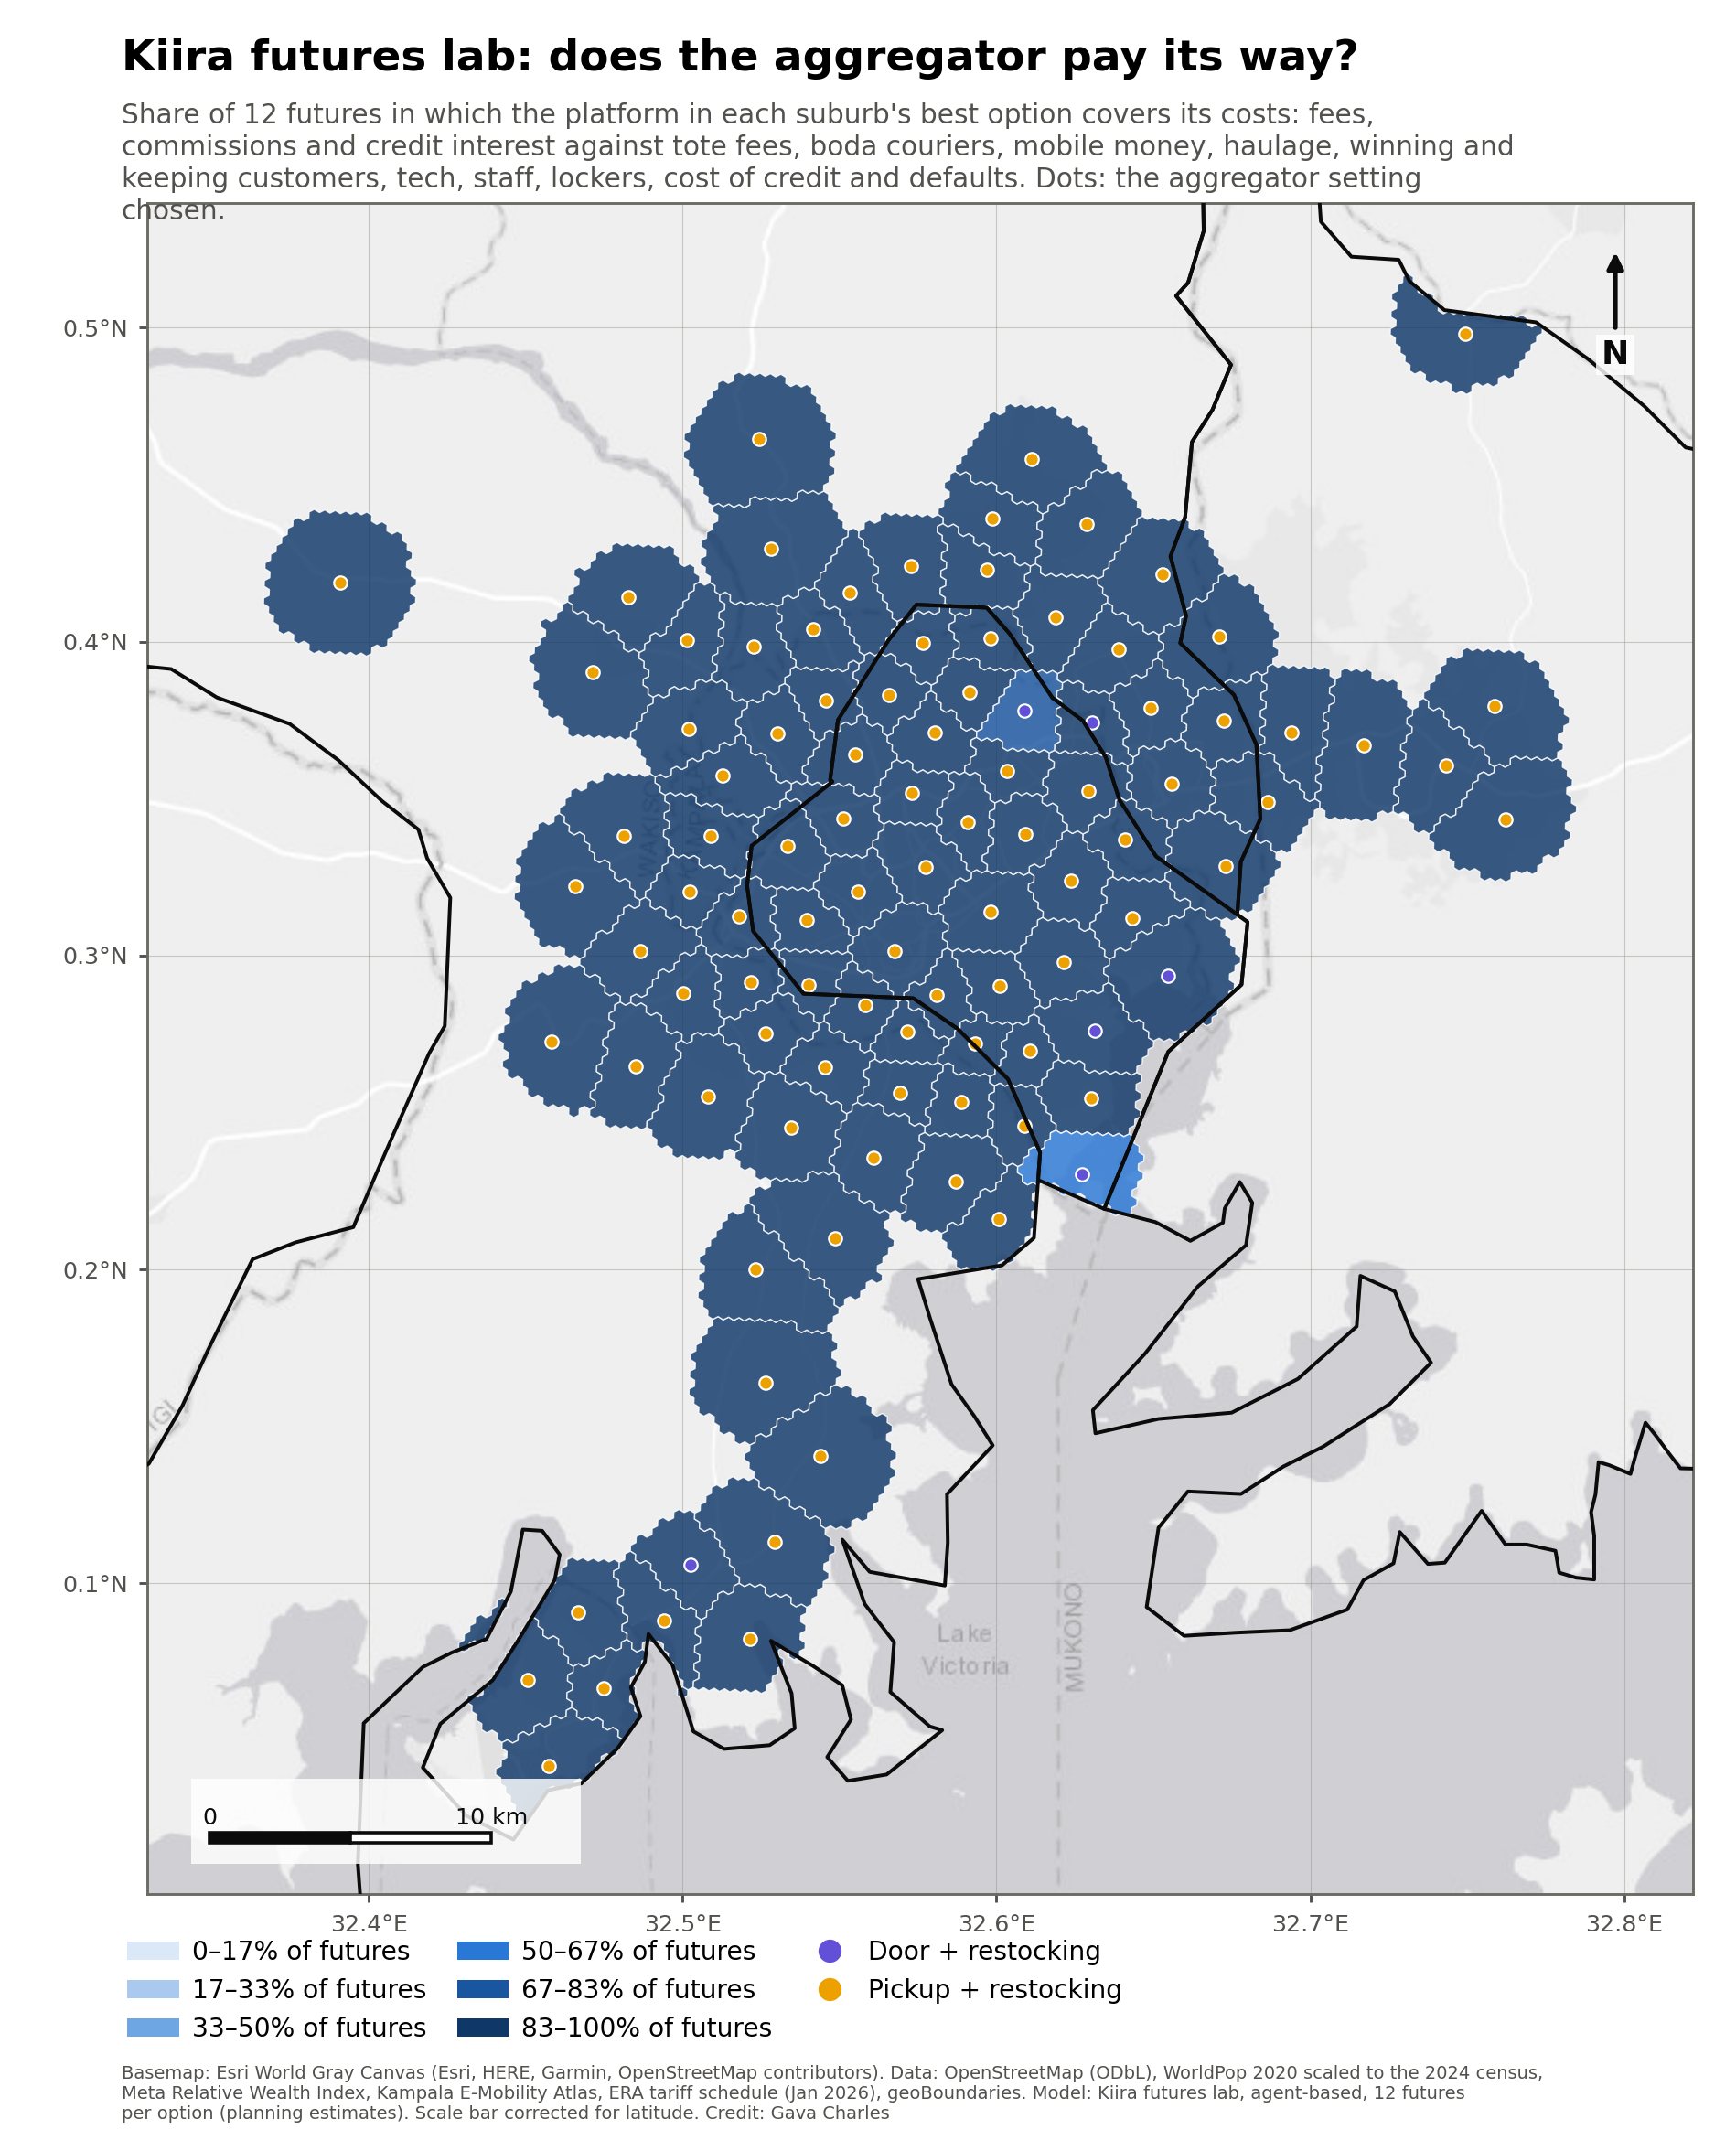
Platform profit counts fees, commissions and credit interest, less tote fees to the operator, boda couriers, mobile-money charges, haulage, winning and keeping customers, tech and staff, lockers, the cost of credit and defaults. "Sales moved" are orders that would otherwise have gone to another shop or market, so they are not new income for Kampala.
Boda riders: door delivery wins back much of their loss
Change in a boda rider's net earnings once the feeder runs, by aggregator setting. Courier drops are shared across the boda pool.
Does the platform pay its way?
Platform profit a year across all 100 suburbs: median, with the 10th to 90th percentile of futures. Restocking alone rarely covers its fixed costs. Sharing them with pickup does.
Idle e-shuttles as cargo vans
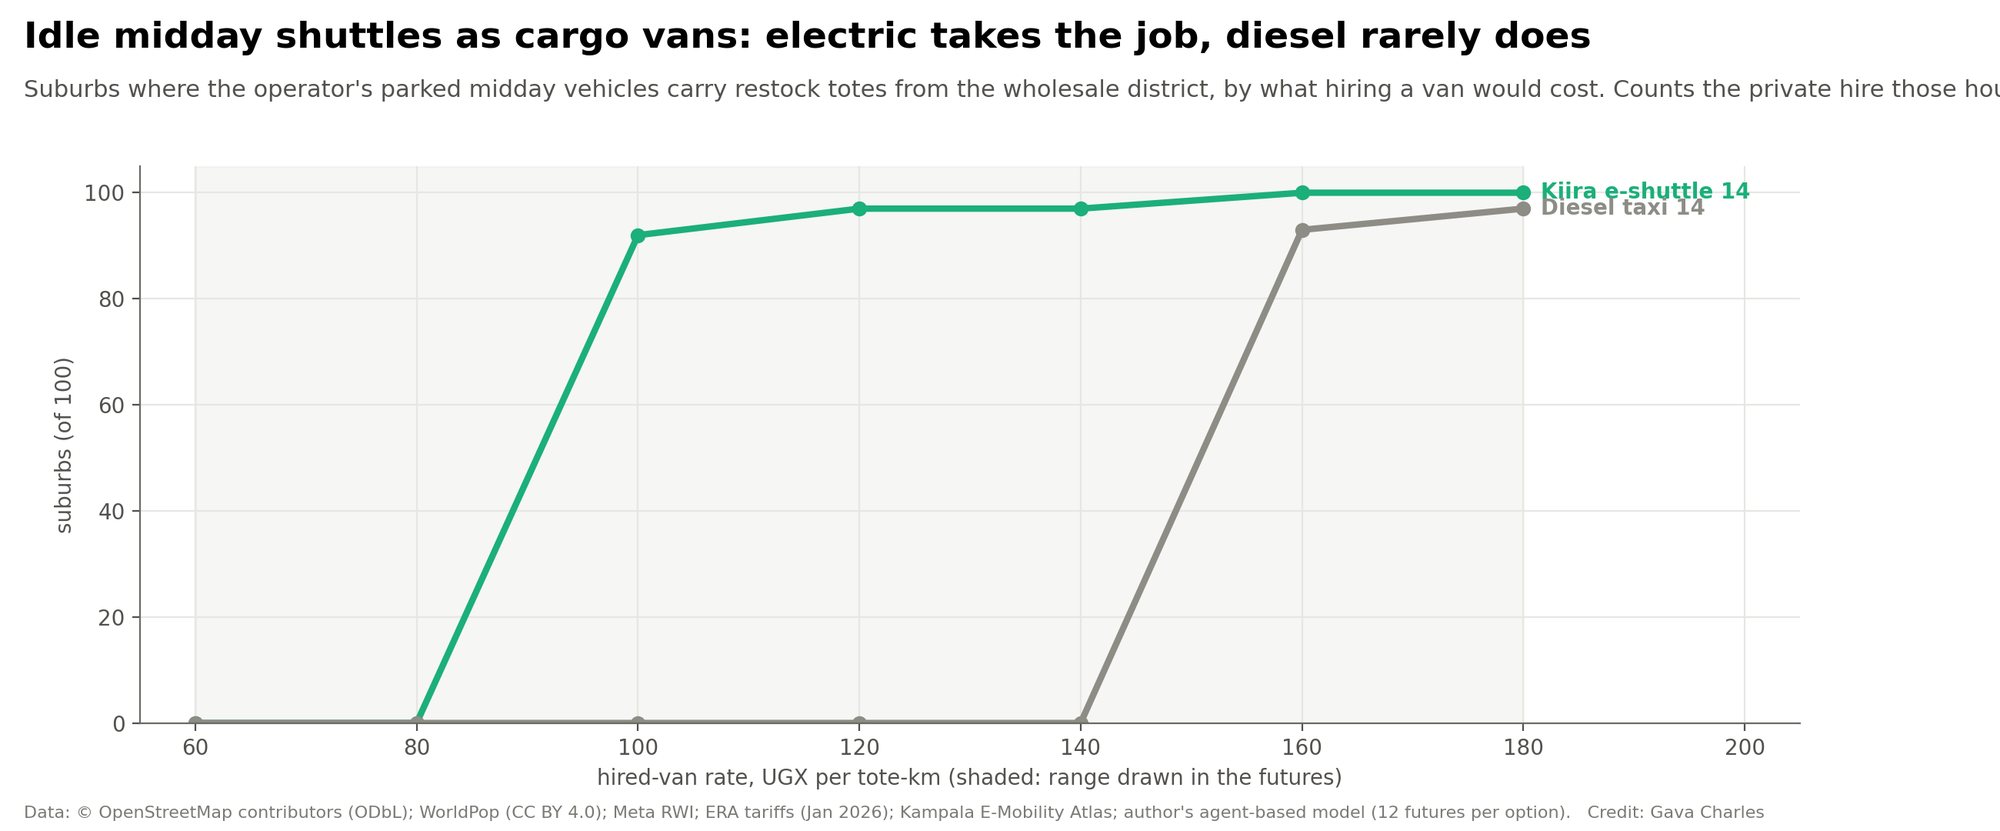
About 30% of the feeder fleet is parked at midday. With seats folded, a 14-seater carries about 20 totes from the wholesale district to the hub. The operator takes the job when it costs less than hiring a van, counting the private hire those hours would otherwise earn. Electric running costs make the difference.
Roll-out, week by week
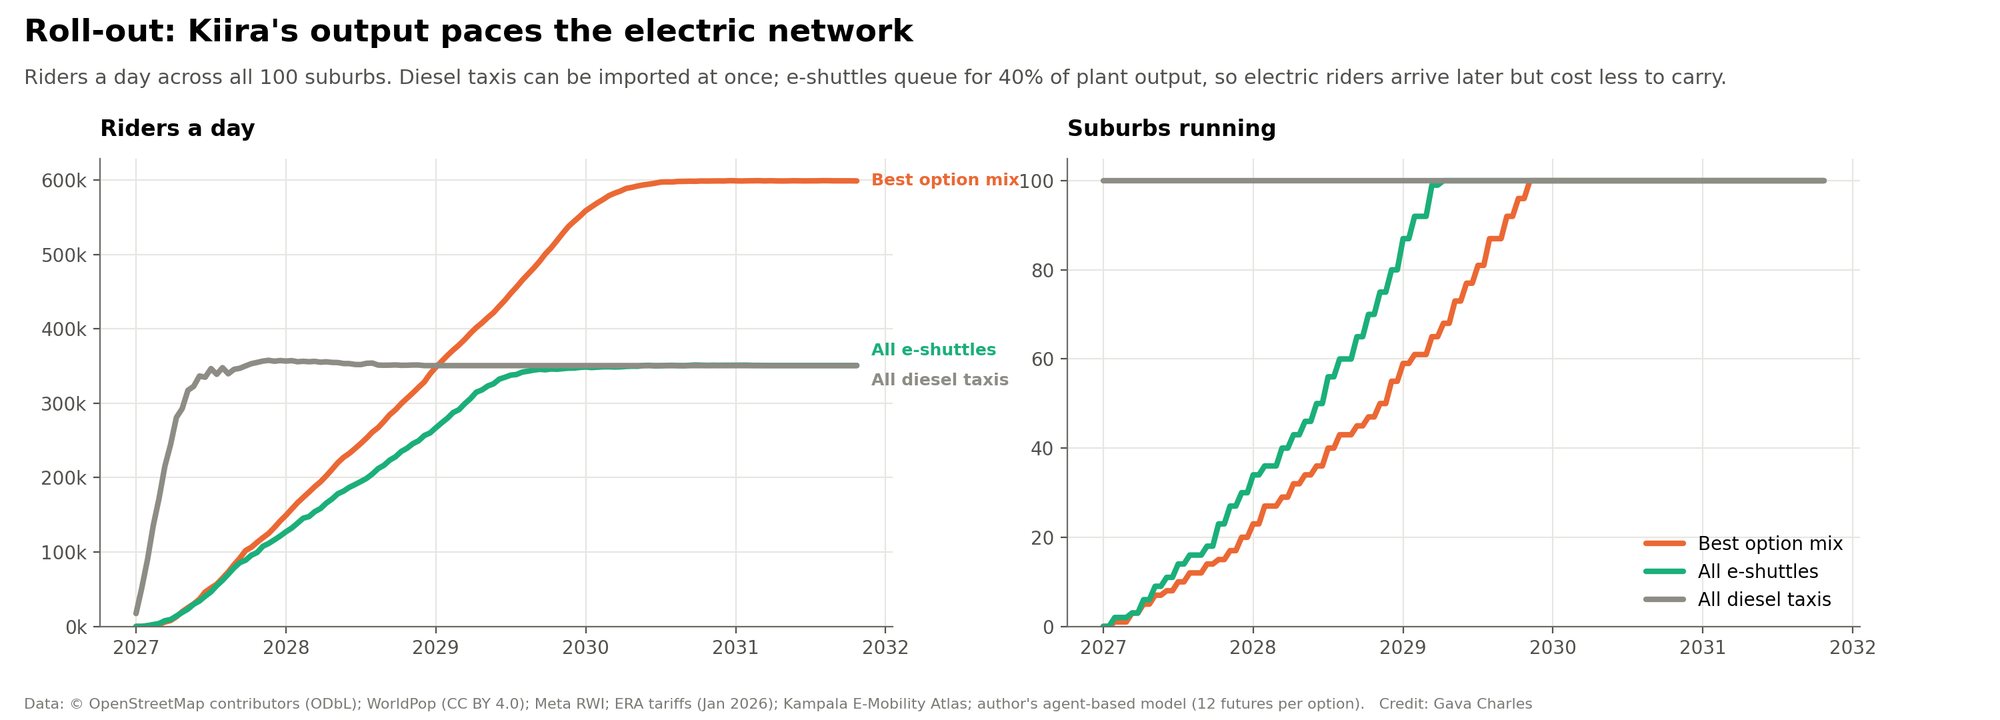
All 100 suburbs together, with electric fleets queued for Kiira's output. Press play to watch riders grow as word spreads, operators add vehicles and the aggregator catches on.
Maps and charts
Print-ready sheets from the same agent runs (central settings, 12 futures per option, default weights). Click any image for full size.
Maps
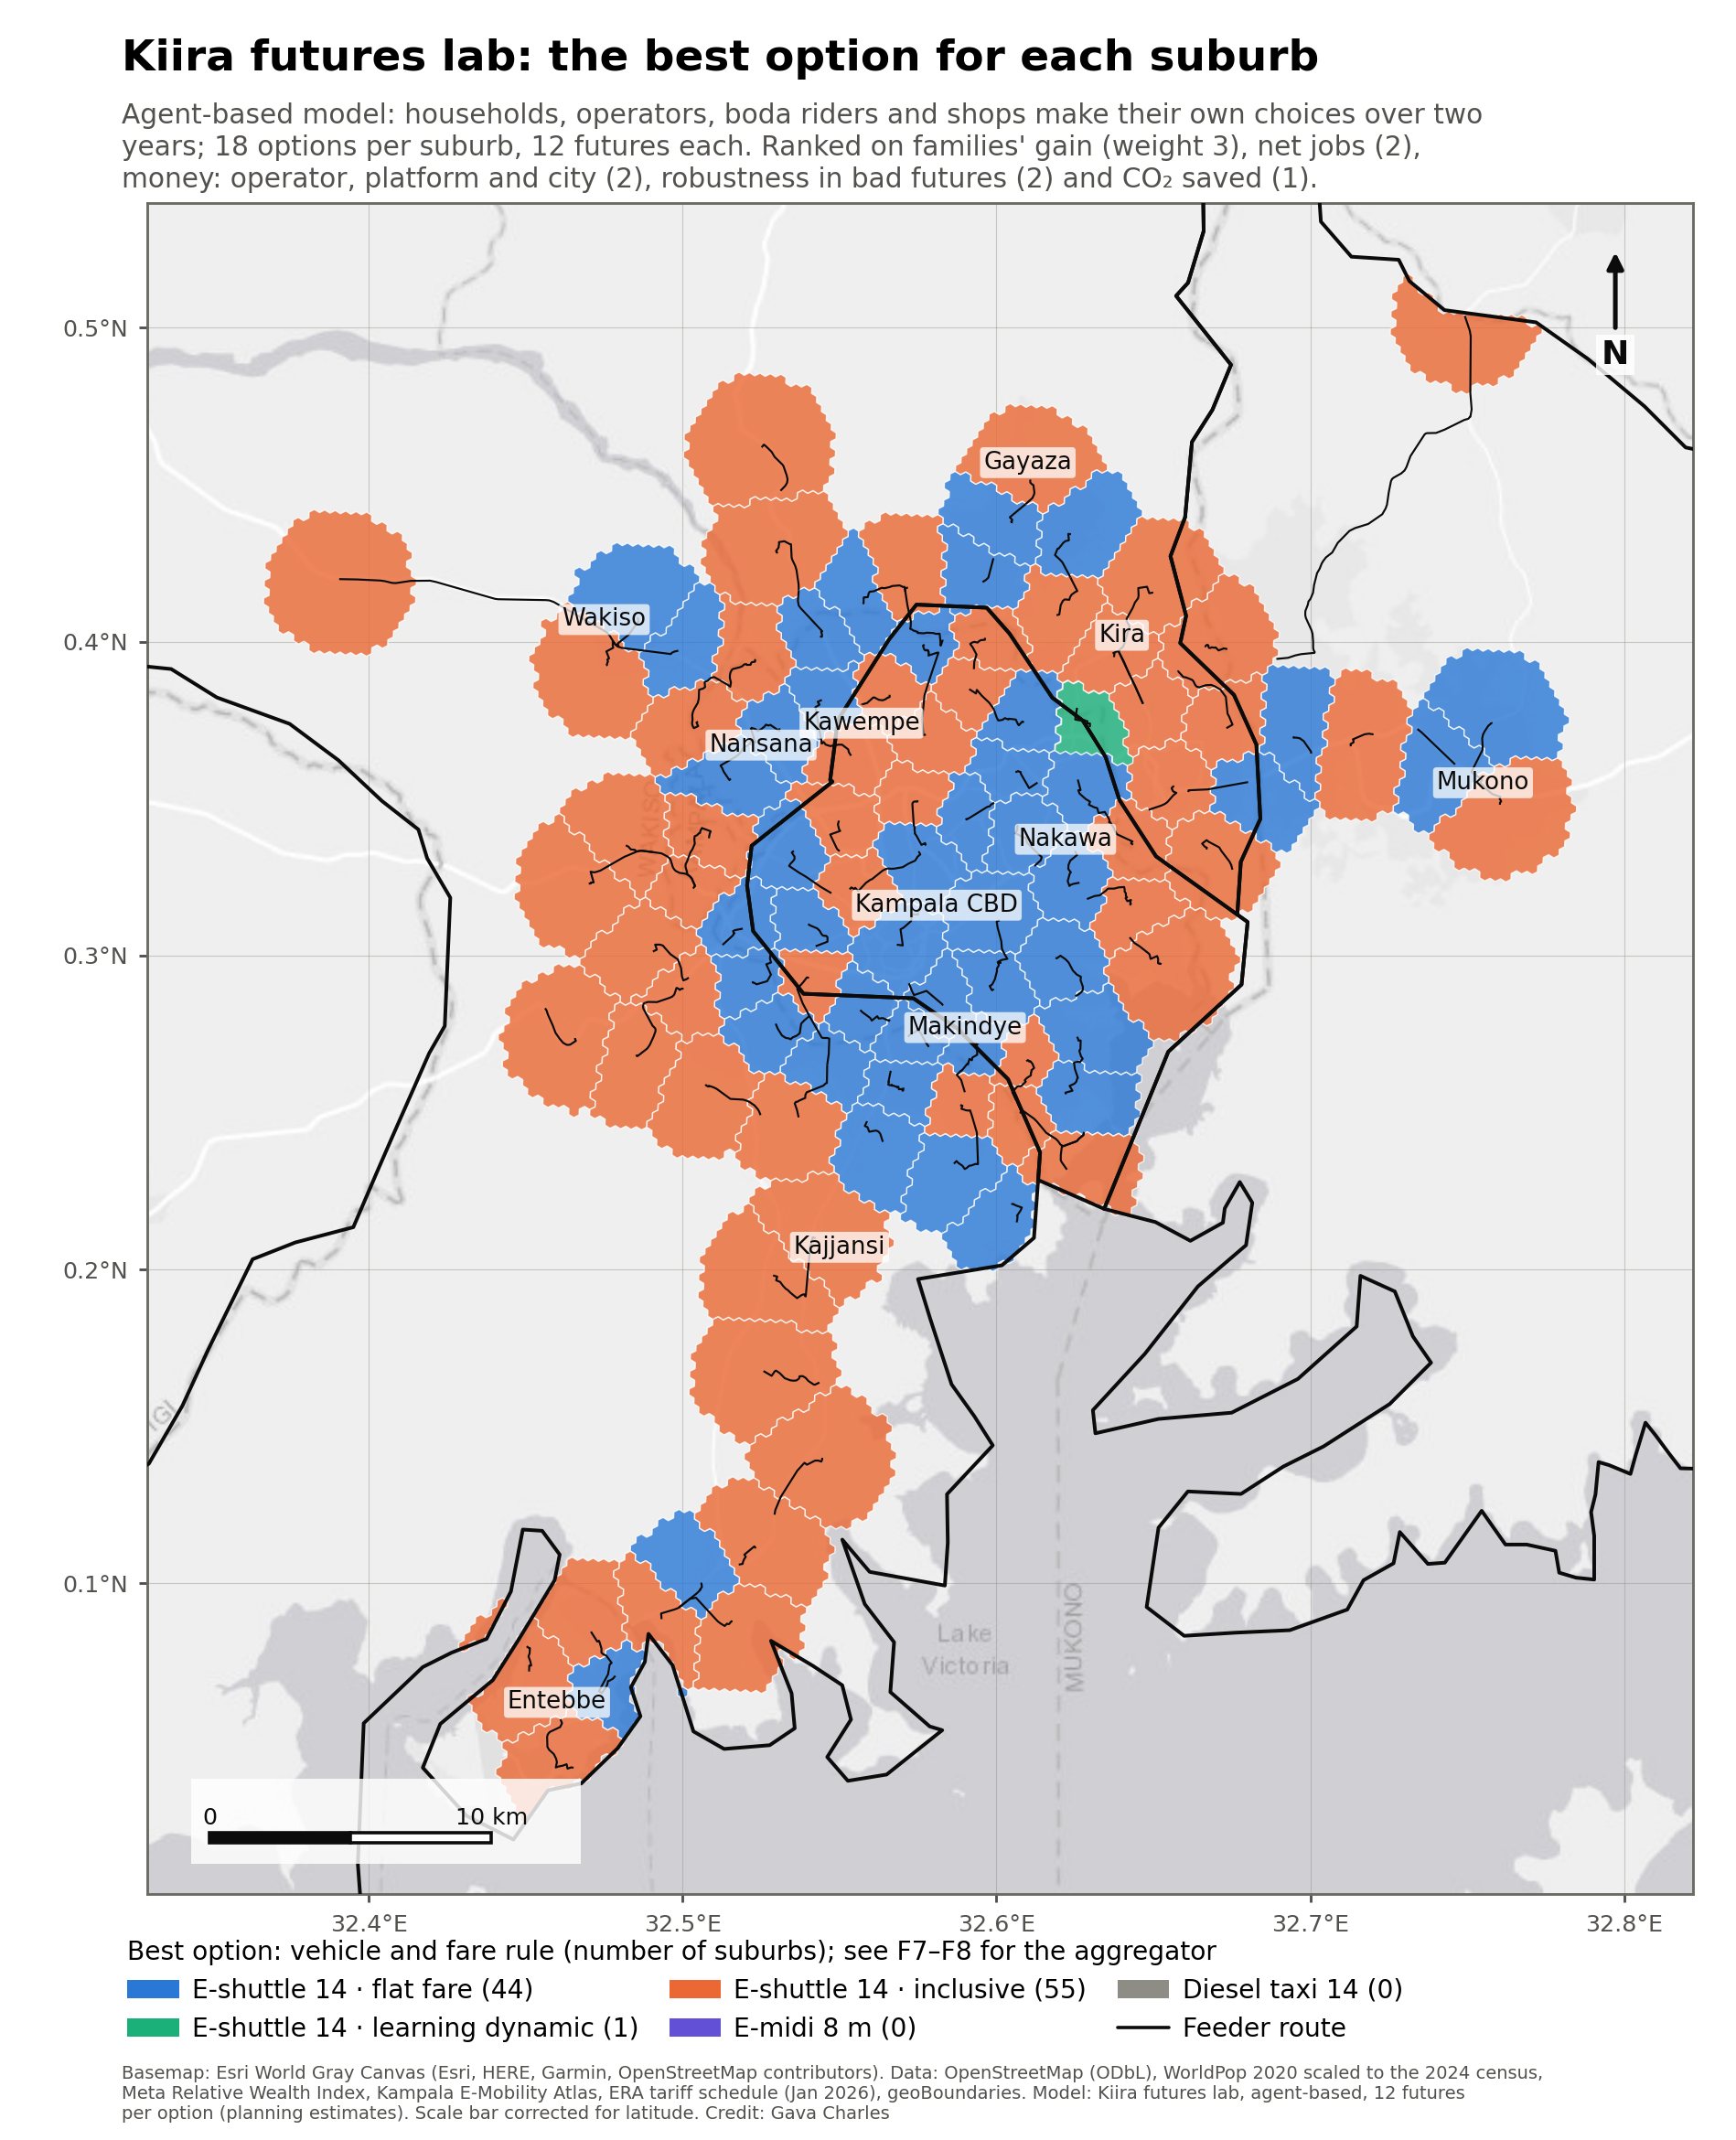
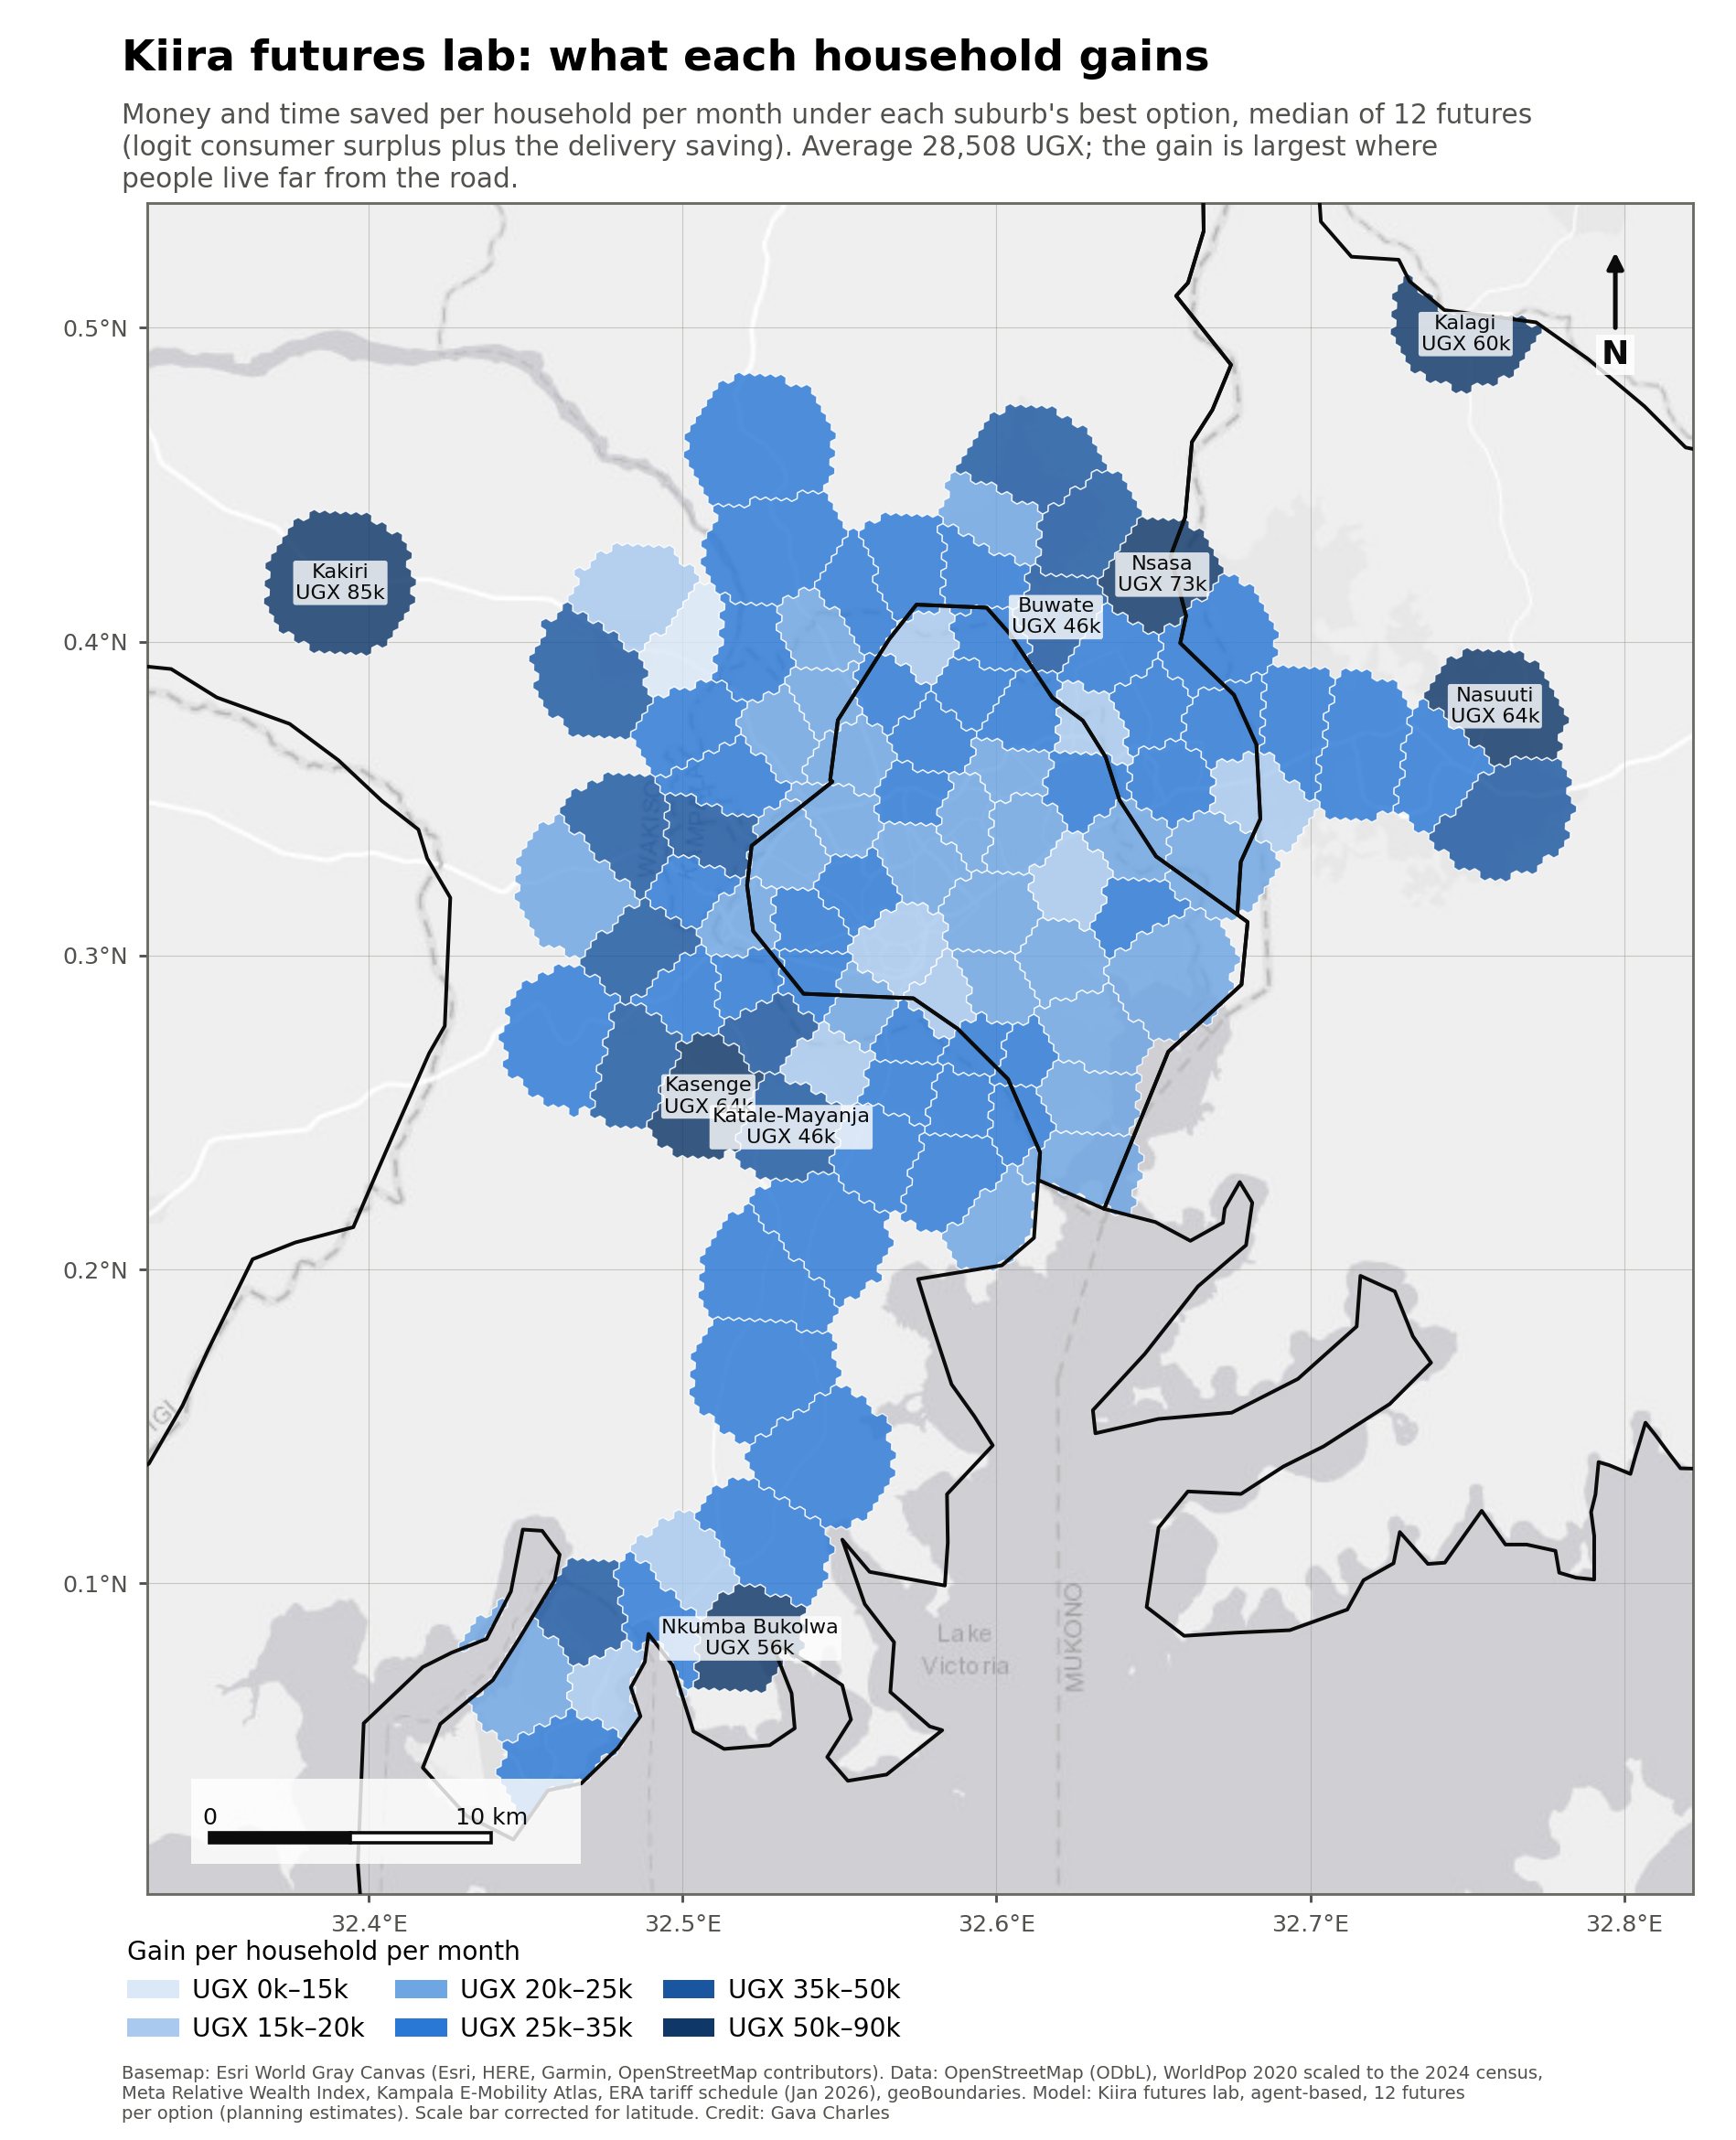
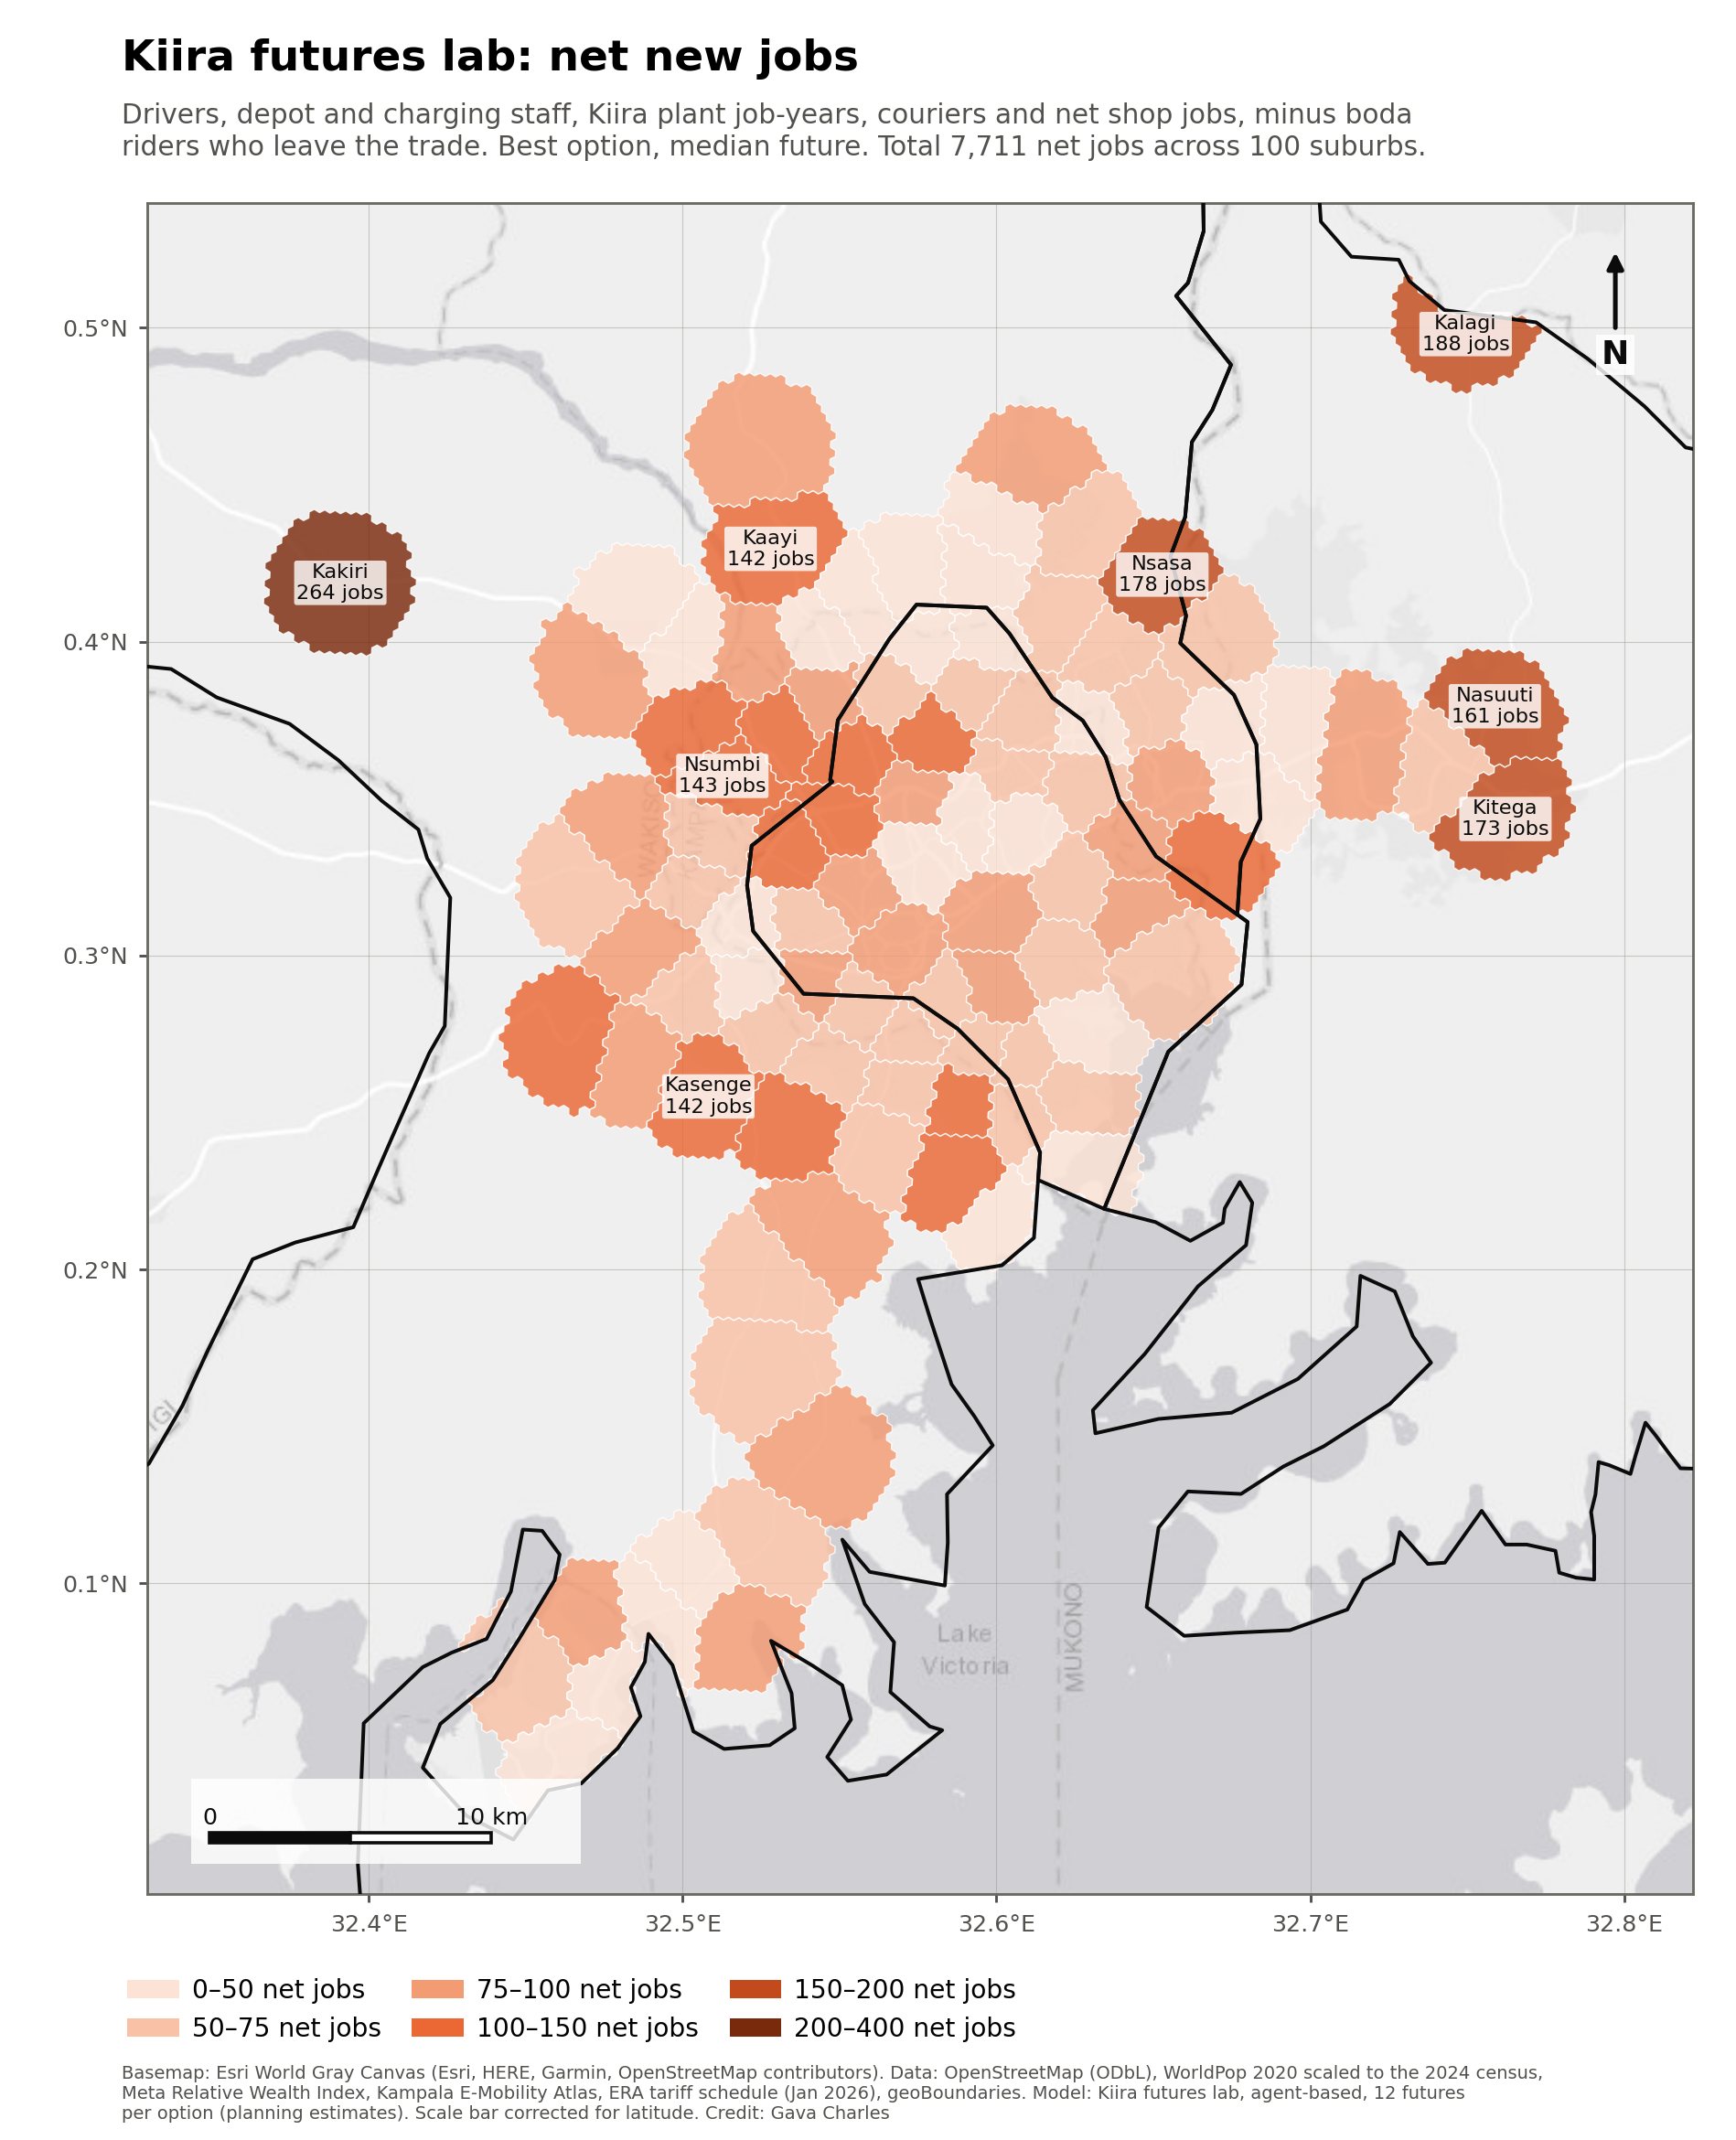
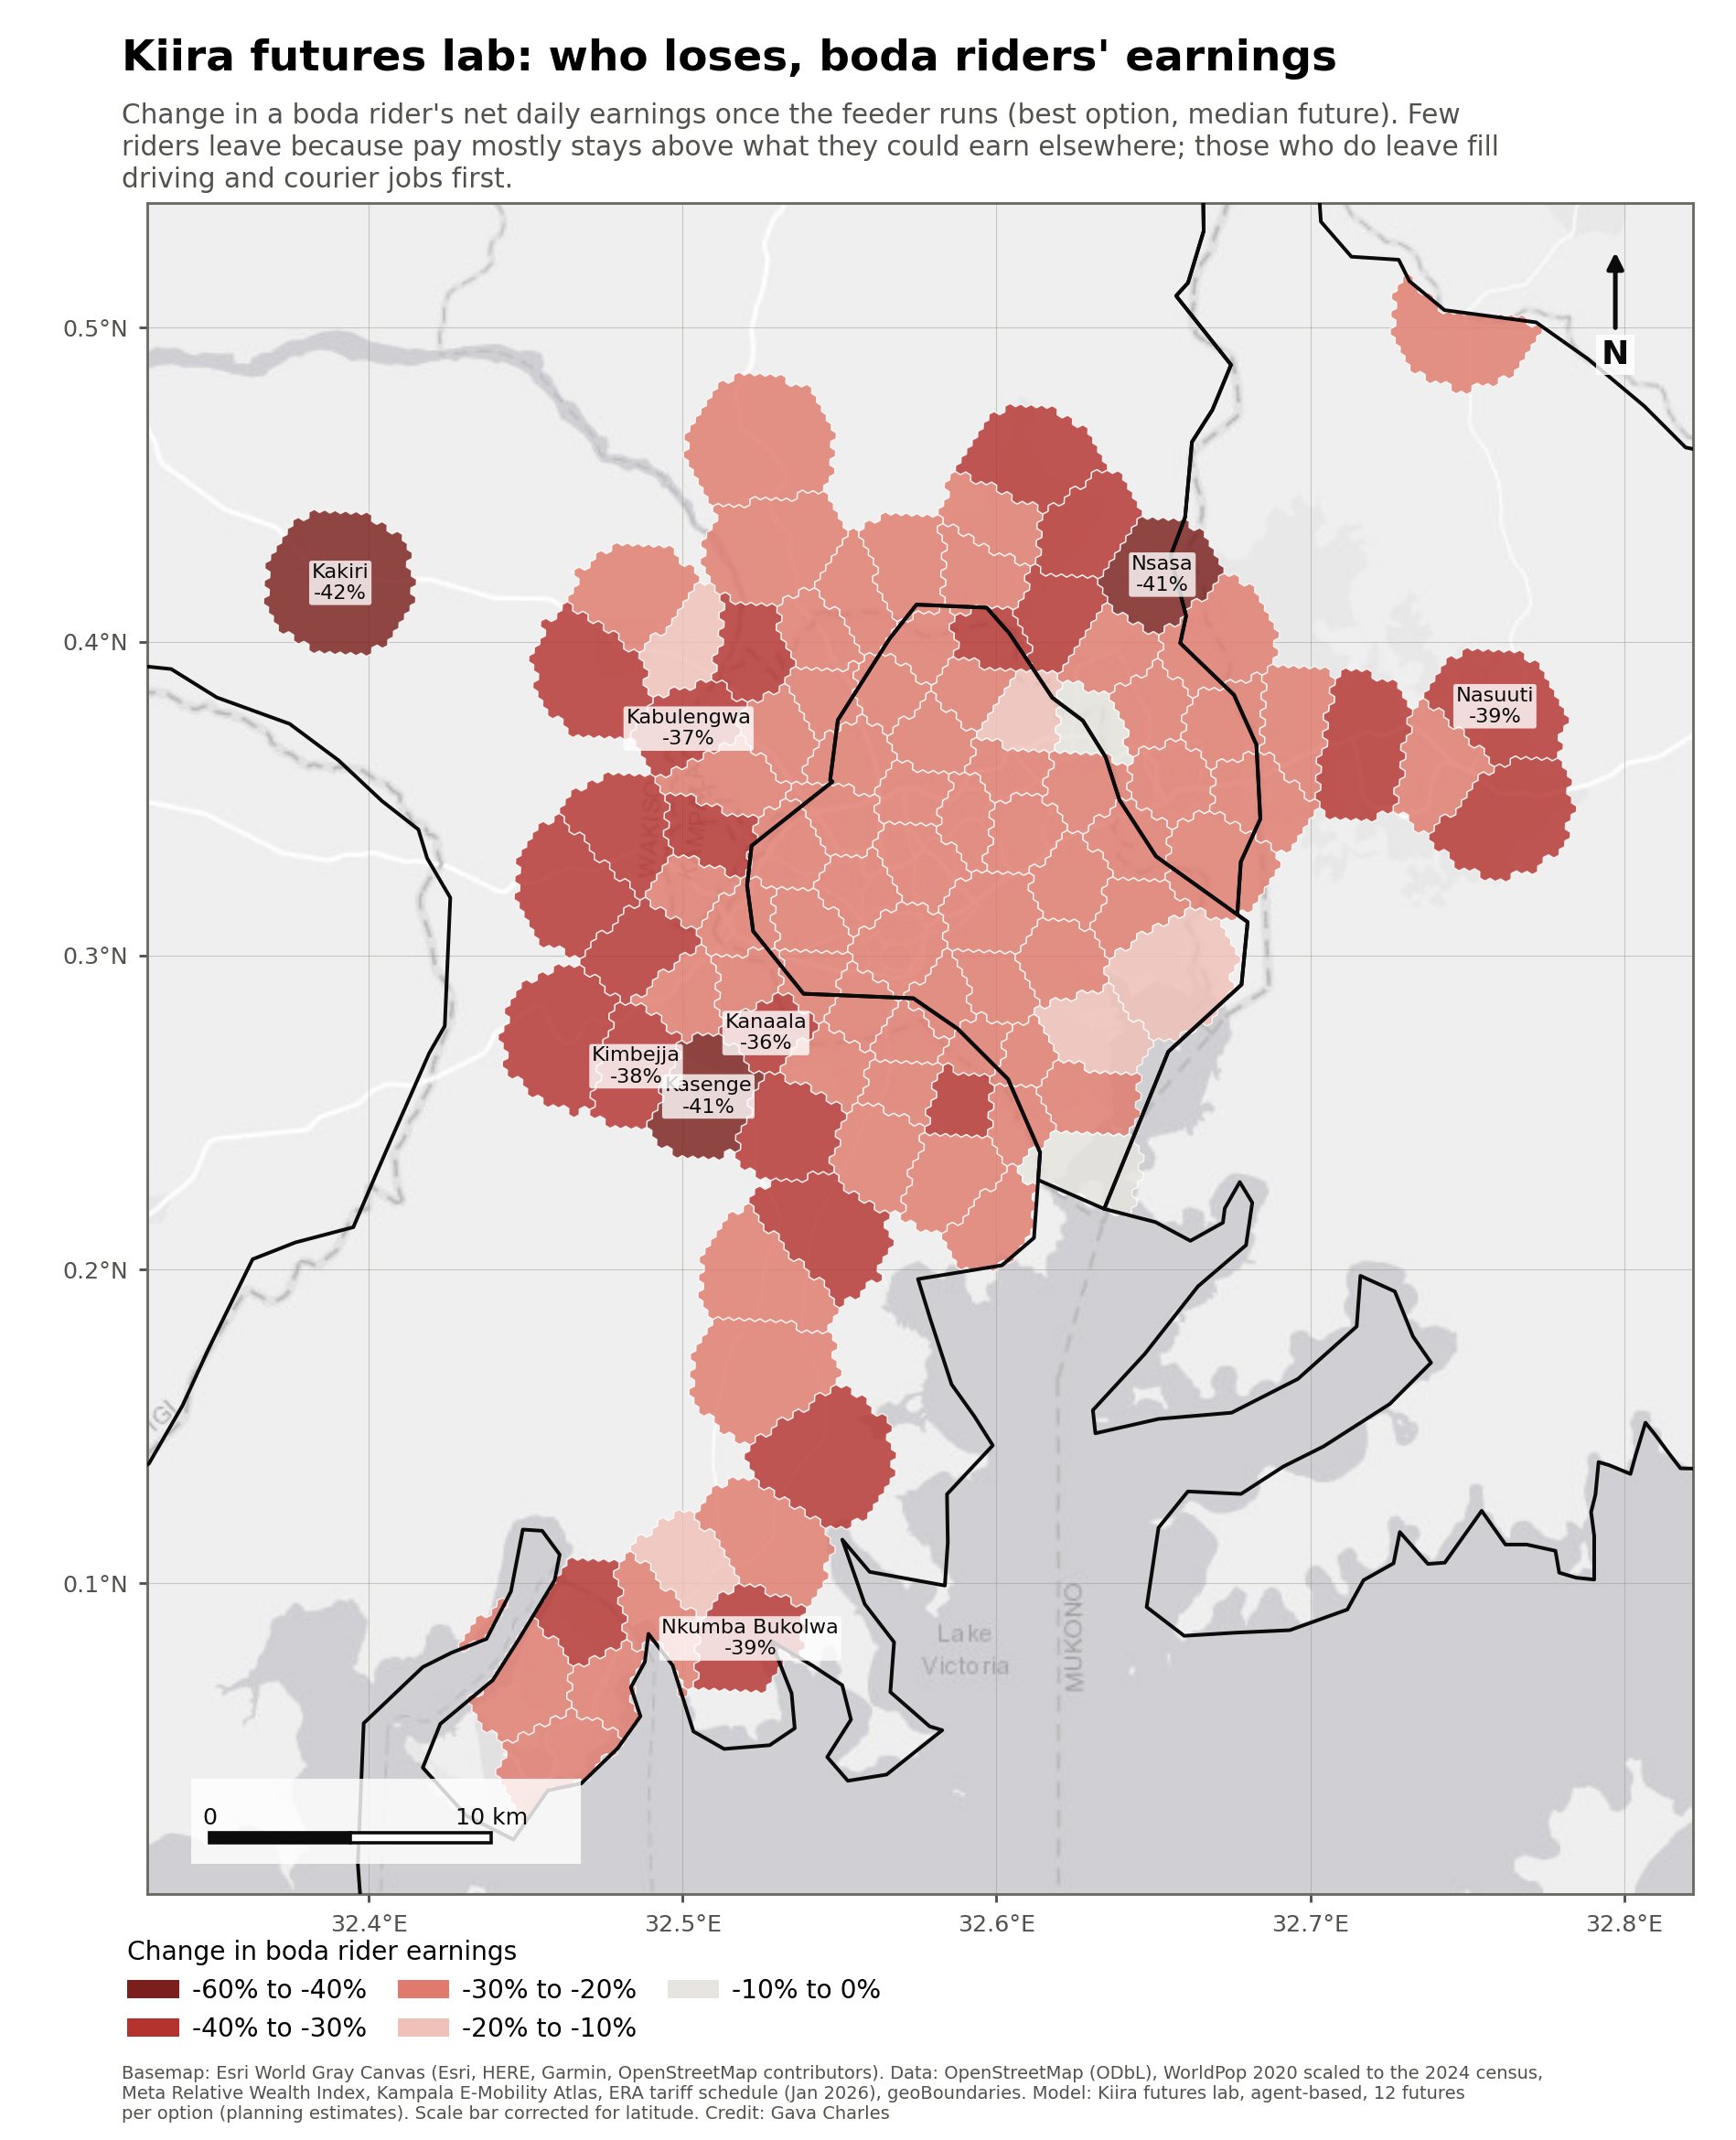
Charts
How to use this lab
Method and uncertainty
Each of the 100 suburbs is simulated for 104 weeks with 90 sample households. Each household stands for a few hundred real ones. Trips, costs, walking, waiting, boda fares and the logit choice use the same formulas and inputs as the network model on the main page. With the same fare and fleet, the two models agree on daily riders to within about 5%.
What the agents add. Awareness spreads by Bass diffusion (adverts plus word of mouth). Habit is a bonus in shillings for last week's mode. Refusals at full buses add remembered waiting time. Operators learn fares by trial and error each month and adjust fleets with a delivery lag. Boda riders' pay responds to lost trips, leading to price cuts and exits. Shop and household adoption of the aggregator feed each other, and plant output is shared across suburbs.
Uncertainty. Each future draws all twelve uncertain inputs (table) at once. Every option in a suburb faces the same futures and the same families, so differences between options come from the policy, not from luck. Results show the median and the 10th to 90th percentile.
Aggregator. Six settings per suburb: none, door delivery, pickup at the stop, shop restocking, and door or pickup combined with restocking. Households adopt ordering by word of mouth once enough shops are listed (pickup suits people who already ride). Shops restock this way when the saving (the boda trip and the hours closed, plus margin on stock bought on two-week credit) beats the fees. Totes ride in a rack and in empty seats in quiet hours; late totes slow take-up. Boda riders do the last hop, and that pay counts in their earnings. Idle midday shuttles take the wholesale haul when it beats hiring a van. Shop locations relative to each route come from OpenStreetMap.
Scoring. For each suburb, every option's median family gain (including shopkeepers' savings), net jobs, money (operator NPV plus platform profit minus city subsidy over 10 years), robustness (the same at the 10th percentile) and CO₂ saved are scaled from 0 to 1 against the other options there. The weighted average ranks them.
Limits. All inputs are planning assumptions. Replace them with household surveys, operator data and Kiira Motors costs. The 14-seat e-shuttle is a product concept, not a current Kiira model. Trunk buses, taxis' own response and land use are not agents here.
Model code: kiira_abm.js (runs in Node and in this page) · Data: futures_data.js · Built by Gava Charles.